Your Proxmox clusters have Ceph already configured. In this lab you’re going to use them for storing your VM image.
Some steps can be done via the GUI, and some via the proxmox host’s CLI shell. We give both there; one person in the group can do one, and one the other.
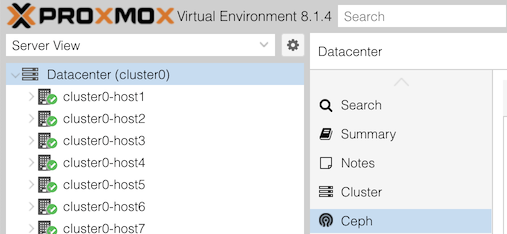
Click “Datacenter (clusterX)” in the left, and Ceph in the next column along.
You may see a health warning:
1 pools have too many placement groupsClick “+” next to this for more details:
Pool vmpool has 128 placement groups, should have 32(This is a recommendation from ceph, based on how full the pull currently is, and you will see it if the calculated “ideal” value is more than three times away from the current. In this case, the pool is empty)
Look also at the states of the OSDs: are they “up” or “down”, and “in” or “out”? What about the monitors and managers?
The metadata store won’t be running: this is part of cephfs, the file store (as opposed to rbd block store), and it hasn’t been enabled.
Under the “Performance” section, can you see the total storage size?
The cluster should have been built with three storage servers (host7-9) each having 4 disks, and each disk is 4GiB. Does that agree?
Note that this can be misleading, because vmpool stores three copies of each block. In that case, how much usable space do we have?
Now select “Storage” in the second column. You’ll get a list of Proxmox storage resources, one of which is “vmpool”, type RBD. As it happens, this is linked to a Ceph pool also called “vmpool”. However, if you add a volume to Ceph, it won’t be visible in the Proxmox web UI as a storage resource until you explicitly add a new storage point at this volume.
To get to the command line, open a shell on your host by selecting the host in the left column, and >_ Shell in the next column.
Try these commands:
ceph health                      # current alerts
ceph healthcheck history ls      # history of alerts

pveceph pool ls                  # list all pools
pveceph pool get vmpool          # details about this pool
ceph osd pool autoscale-status   # more info about PG scaling calculations

ceph osd status                  # status of all OSDs
ceph osd perf                    # show OSD latencies (may all be zero right now)
(Note that Proxmox includes some of its own admin tools under pveceph, but in many cases you have to use the underlying tool ceph)
To get a rolling health check which refreshes automatically when something changes, type ceph -w. After its initial message it will hang waiting for a change. Hit Ctrl-C to exit it.
For this part, find the VM which you created previously from the Ubuntu cloud image; it may be called something like “groupX-web”.
(It doesn’t matter whether it’s started or not. Proxmox allows storage conversion to happen “live”)
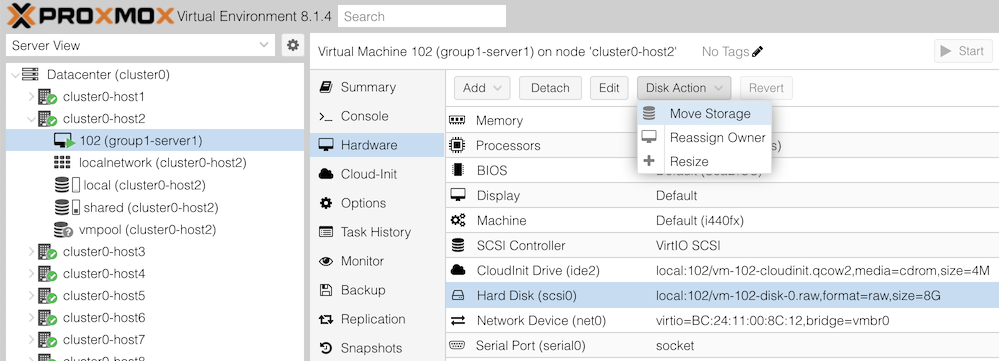
You will then get an action dialog. Select:
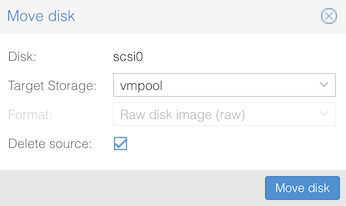
Then click “Move disk”. You should see progress as the disk contents are copied, hopefully ending with TASK OK.
NOTE: If the migration hangs, it could be because your ceph cluster has filled up!! Check the Ceph summary page to see if this has happened. The instructor will use this as a discussion point.
What’s different? Since the VM is using shared storage, you can live-migrate it to another host without having to copy the disk (as it’s accessible equally from anywhere in the cluster)
If you look carefully, you’ll see it’s still migrating the cloud-init disk. The Disk Action button is greyed out for this device, so you can’t move it to Ceph, but as it’s very small that doesn’t matter.
Now to look at how the cluster status has changed, as you and other groups have moved data into ceph.
Go back to the Datacenter > Ceph summary page, and look at “Usage”. Has it increased?
Check what volumes (disk images) exist in this pool.
From the GUI: in the left column, under Datacenter, and under your cluster host, select the storage item “vmpool (clusterX-hostY)”. Then click on “VM Disks” in the second column.
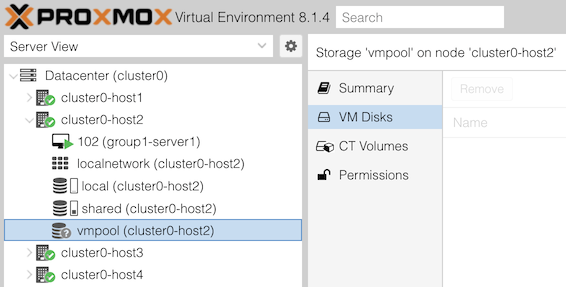
On the right, can you see the disks that you and people in other groups have created?
From the CLI:
rbd ls -l -p vmpool       # which block volumes are in the pool?
rbd du -p vmpool          # show how large each volume is, and how much space is allocated
Much lower-level data can be found too, for example:
ceph pg ls-by-pool vmpool # shows exactly which sets of disks each PG is held onRe-check ceph osd perf and see if you now have latency figures for the OSDs. This table would be able to show you if you have one disk which is performing significantly worse than the others (which may degrade overall cluster performance, and/or may be about to fail)