Prometheus provides a data collection engine, a time series storage engine, and a basic web interface for querying. In this exercise we’ll configure Prometheus.
Do this on your campus server instance (srv1.campusY.ws.nsrc.org)
All the Prometheus software components have been pre-installed on srv1. There is a separate worksheet with installation instructions so that you can replicate this environment at home.
Let’s start prometheus:
# systemctl enable prometheus   # start on future boots
# systemctl start prometheus    # start now
# journalctl -eu prometheus     # check for "Server is ready to receive web requests."
Use cursor keys to move around the journalctl log output, and “q” to quit. If there are any errors, then go back and fix them.
This command shows you the status and just the last few lines of log output:
# systemctl status prometheus # check for "Active: active (running)" textHave a look at the default configuration file:
# cat /etc/prometheus/prometheus.ymlNote that the scrape interval is currently set to 15 seconds. This gives us rapid results, but when collecting lots of metrics from many devices, 1 minute might be a better choice to stress the server and the devices less. (We’ll see how well the class runs with a 15 second scrape interval!)
It contains a single scrape job: it is scraping itself, to collect metrics about prometheus’ own internal operation.
# A scrape configuration containing exactly one endpoint to scrape:
# Here it's Prometheus itself.
scrape_configs:
  - job_name: "prometheus"

    # metrics_path defaults to '/metrics'
    # scheme defaults to 'http'.

    metrics_path: "/prometheus/metrics"

    static_configs:
      - targets: ["localhost:9090"]
Prometheus metrics are human-readable. Run the following command to scrape the metrics yourself:
# curl localhost:9090/prometheus/metricsYou should see several screenfuls of data such as
# HELP promhttp_metric_handler_requests_total Total number of scrapes by HTTP status code.
# TYPE promhttp_metric_handler_requests_total counter
promhttp_metric_handler_requests_total{code="200"} 18
promhttp_metric_handler_requests_total{code="500"} 0
promhttp_metric_handler_requests_total{code="503"} 0
This is exactly what prometheus does every 15 seconds.
You don’t need to understand what each individual metric means, but each row represents a separate timeseries which will be collected into prometheus’ time series database for graphing, alerting etc.
promhttp_metric_handler_requests_total{code="200"} 18
^^^^^^^^^^^^^^^^^^^^^^^^^^^^^^^^^^^^^^ ^^^^^^^^^^  ^^
METRIC NAME LABELS VALUEIn your web browser, go to http://oob.srv1.campusY.ws.nsrc.org/prometheus, or from the virtual training platform front page, select Web > srv1 under your campus, then click on Prometheus.
You should see the Prometheus basic query interface. This is a great place to do ad-hoc PromQL queries and graphs.
Browse to the Status menu and select Targets to see a summary of the targets being scraped - so far only Prometheus itself.
NOTE: for this workshop we have configured Apache to proxy /prometheus to the prometheus server running on port 9090, and prometheus to expect this prefix. This hides the prometheus port number from the web URLs. It also makes it possible to apply access controls and HTTPS encryption at the web proxy - these are functions that prometheus itself doesn’t provide.
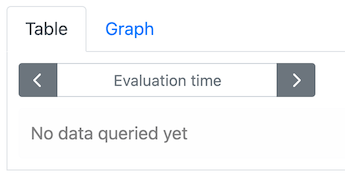
Normally, prometheus evaluates expressions at the current time, so you see the most recently stored data. In the web interface, the “Evaluation time” will be unset, like this:
This is how it should be for these exercises. If for any reason you see a specific time and date like this:
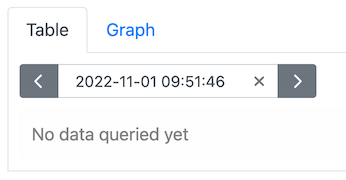
then please click the “X” to remove it.
In the expression interface (click on “Graph” at the top of the page), start by typing “promhttp” - all the metrics which match this query will be shown.
Select “promhttp_metric_handler_requests_total” and then click “Execute”
You should see a table of results like this:
| Element | Value |
|---|---|
promhttp_metric_handler_requests_total{code="200",instance="localhost:9090",job="prometheus"} |
49 |
promhttp_metric_handler_requests_total{code="500",instance="localhost:9090",job="prometheus"} |
0 |
promhttp_metric_handler_requests_total{code="503",instance="localhost:9090",job="prometheus"} |
0 |
These are the most recent values for those metrics, stored in the time series database.
Now click on the “Graph” tab just below the expression interface, and you should see these values over time. The requests for code="200" have most likely been increasing over time.
These are examples of “counter” metrics: they increment every time a particular type of event takes place.
Note that compared to what you saw previously with “curl”, two extra labels have been added by prometheus itself at scrape time: job is the name of the scrape job in the prometheus config file, and instance is the target which was scraped. These labels allow prometheus to distinguish between timeseries collected from different hosts.
Now back in the query interface, enter “scrape_duration_seconds”. Look first at the “Table” tab, which shows you the current values numerically, then at the “Graph” tab, which shows how they have changed over time.
This is a value which can go up and down over time, and is called a “gauge”. It represents the absolute value of something - in this case, the amount of time the last scrape job took.
There are other gauges, for example “process_resident_memory_bytes”
Conventionally, the units for gauges are included at the end of the metric name, such as _seconds or _bytes.
Finally, enter “prometheus_build_info” as the query, and look at the “Table” view. You should see a result like this:
| Element | Value |
|---|---|
prometheus_build_info{branch="HEAD", goversion="go1.18.4", instance="localhost:9090", job="prometheus", revision="b41e0750abf5cc18d8233161560731de05199330", version="2.37.0"} |
1 |
This is an example of a static timeseries: the value is always 1. The interesting information is in the labels, in this case so you can see what version of prometheus you are running.
If you were to upgrade prometheus, then you’d get a new timeseries with a different set of labels, but the value of this new timeseries would still be “1”.
The graph view here isn’t very interesting - it’s just a flat line - but you can see when the timeseries starts and ends.
If you go to Status > Runtime & Build Information (menu at the top of the page)then you will get some summary information about Prometheus operation.
If you would like to see the number of metrics that Prometheus collecting on itself click on Status > TSDB Status. The section labeled “Number of Series” is particularly interesting. You should see some number like “714” shown. This means there are 714 distinct time series actively being read into the database. You are collecting 714 metrics just about prometheus itself!
Fortunately the prometheus time series engine is very efficient, taking on average less than 2 bytes for each data point stored.
If you change the prometheus configuration - which you’ll do many times in these exercises - you should not restart prometheus. This is because prometheus can take a long time at start up to read in its Write-Ahead Log files (WAL); and also because if you make an error, you don’t want prometheus to stop running.
Instead, you will send it a signal to reload:
systemctl reload prometheus   # or: killall -HUP prometheus
journalctl -eu prometheus     # check the logs!
NOTE: don’t use
systemctl restart!
If the new config is bad, prometheus will log an error and keep running with the old configuration. If the new config is good, it will log success and start using the new configuration.
There is also a command you can use to validate the configuration before you try to load it:
/opt/prometheus/promtool check config /etc/prometheus/prometheus.ymlAs well as the web interface, you can query prometheus using its REST API, and this can be done from the command line. Try for example:
/opt/prometheus/promtool query instant http://localhost:9090/prometheus prometheus_build_info
/opt/prometheus/promtool query instant http://localhost:9090/prometheus up
The first item gives you all the specific version information for the Prometheus you are currently running, in the labels. The value, as you’ve seen before, is always 1.
The second item gives you the status of all the configured scrape jobs: whether the most recent scrape was successful (1) or failed (0).
Each item is followed with a Unix timestamp that the data relates to. If you want to convert that on the command line, take the bit of output that looks something like @[1665743561.745], copy just the number piece, then issue the command:
# date -d @1665743561.745Use the number you got, not the one shown above, as that’s from when these exercises were created.