Your Proxmox clusters have Ceph already configured. In this lab you’re going to use them for storing your VM image.
Some steps can be done via the GUI, and some via the proxmox host’s CLI shell. We give both there; one person in the group can do one, and one the other.
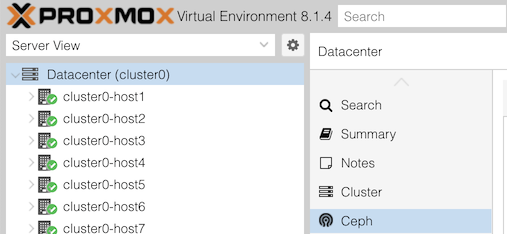
Click “Datacenter (clusterX)” in the left, and Ceph in the next column along.
You may see a health warning:
1 pools have too many placement groupsClick “+” next to this for more details:
Pool vmpool has 128 placement groups, should have 32(This is a recommendation from ceph, based on how full the pool currently is, and you will see it if the calculated “ideal” value is more than three times away from the current. In this case, the pool is empty)
Look also at the states of the OSDs: are they “up” or “down”, and “in” or “out”? What about the monitors and managers?
The metadata store won’t be running: this is part of cephfs, the file store (as opposed to rbd block store), and it hasn’t been enabled.
Under the “Performance” section, can you see the total storage size?
The cluster should have been built with three storage servers (host7-9) each having 4 disks, and each disk is 8GiB. Does that agree?
Note that this can be misleading, because vmpool stores three copies of each block. In that case, how much usable space do we have?
Now select “Storage” in the second column. You’ll get a list of Proxmox storage resources, one of which is “vmpool”, type RBD. Underneat this is a Ceph pool also called “vmpool”.
To get Ceph’s view of pools, then select any host in the left column, “Ceph” in the second column, and under that “Pools”.
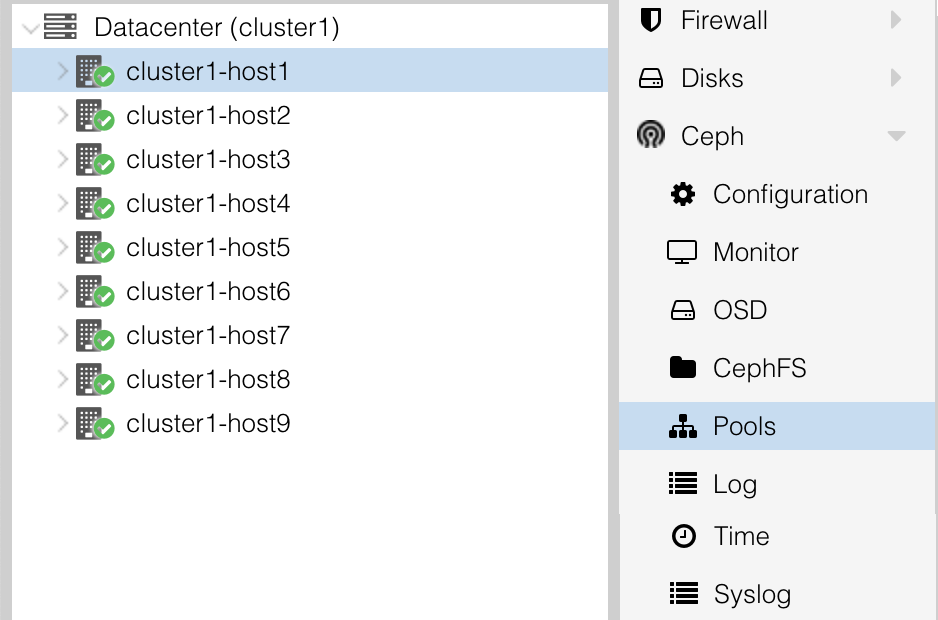
You should see some basic info (including utilization) of each pool.
These Ceph command line tools must be run on one of the hosts which is running as a Ceph Monitor, which are host1-3 in your cluster (you can see them in the GUI in the main Ceph status page, in a section headed “Services”). Pick any one of these.
To get to the command line, open a shell on your host by selecting the host in the left column, and >_ Shell in the next column.
Try these commands:
ceph health                      # current alerts
ceph healthcheck history ls      # history of alerts

pveceph pool ls                  # list all pools
pveceph pool get vmpool          # details about this pool
ceph osd pool autoscale-status   # more info about PG scaling calculations

ceph osd status                  # status of all OSDs
ceph osd perf                    # show OSD latencies (may all be zero right now)
(Note that Proxmox includes some of its own admin tools under pveceph, but in many cases you have to use the underlying tool ceph)
To get a rolling health check which refreshes automatically when something changes, type ceph -w. After its initial message it will hang waiting for a change. Hit Ctrl-C to exit it.
For this part, find the VM which you created previously from the Ubuntu cloud image; it may be called something like “groupX-web”.
(It doesn’t matter whether it’s started or not. Proxmox allows storage conversion to happen “live”)
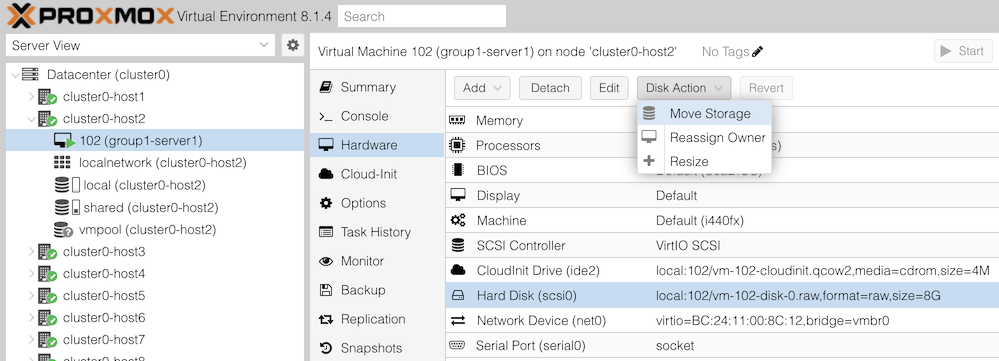
You will then get an action dialog. Select:
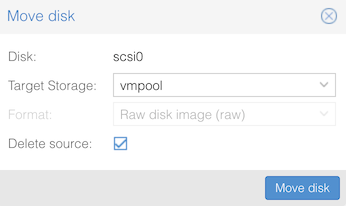
Then click “Move disk”. You should see progress as the disk contents are copied, hopefully ending with TASK OK.
NOTE: If the migration hangs, it could be because your ceph cluster has filled up!! Check the Ceph summary page to see if this has happened. The instructor will use this as a discussion point.
If conversion completes successfully, you should then remove the old disk which will appear as “Unused Disk 0” in the “Hardware” section of your VM.
What’s different? Since the VM is using shared storage, you can live-migrate it to another host without having to copy the disk (as it’s accessible equally from anywhere in the cluster)
If you look carefully, you’ll see it’s still migrating the cloud-init disk. The Disk Action button is greyed out for this device, so you can’t move it to Ceph, but as it’s very small that doesn’t matter.
Now to look at how the cluster status has changed, as you and other groups have moved data into ceph.
Go back to the Datacenter > Ceph summary page, and look at “Usage”. Has it increased?
Select any node in your cluster, “Ceph” in the second panel, and under that “OSDs”
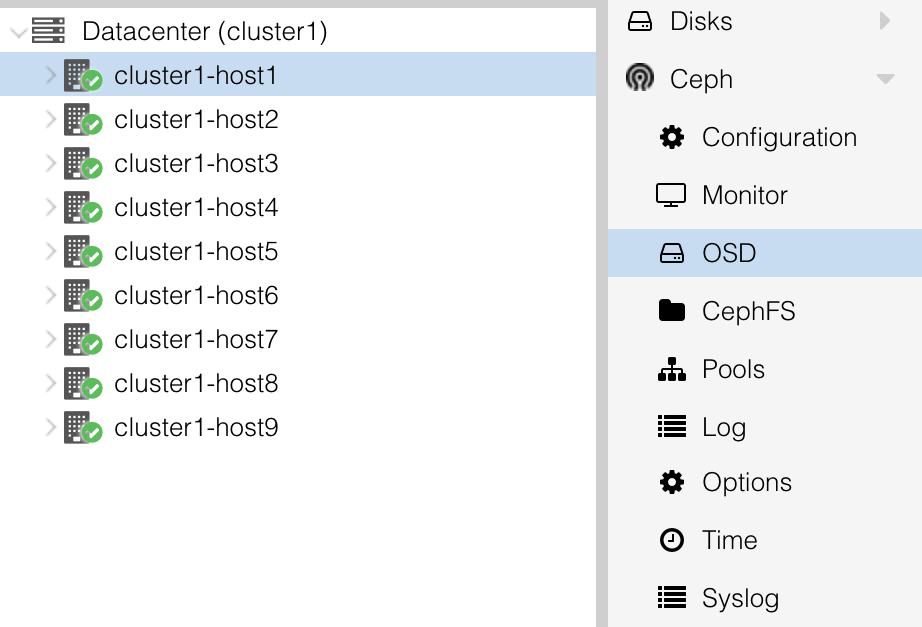
This will show you the status of all the OSDs, and the percentage of storage utilization of each one. Note how the OSDs are not equally utilized. (Larger clusters will tend to balance much better than this)
Check what volumes (disk images) exist in this pool.
From the GUI: in the left column, under Datacenter, and under your cluster host, select the storage item “vmpool (clusterX-hostY)”. Then click on “VM Disks” in the second column.
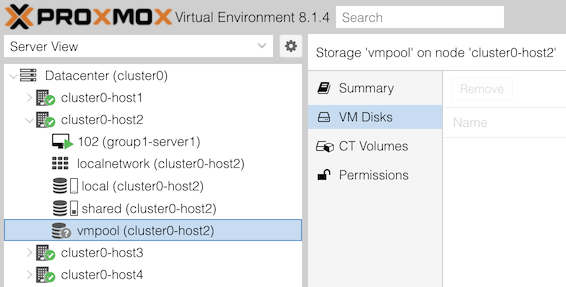
On the right, can you see the disks that you and people in other groups have created?
From the CLI:
ceph df                   # show total pool sizes
rbd ls -l -p vmpool       # which block volumes have been allocated in the pool?
rbd du -p vmpool          # show provisioned size and allocated size
Much lower-level data can be found too, for example:
ceph pg ls-by-pool vmpool # shows exactly which sets of disks each PG is held onRe-check ceph osd perf and see if you now have latency figures for the OSDs. This table would be able to show you if you have one disk which is performing significantly worse than the others (which may degrade overall cluster performance, and/or may be about to fail)
This section is for information only.
The Proxmox web interface shows summary usage information for Ceph pools:
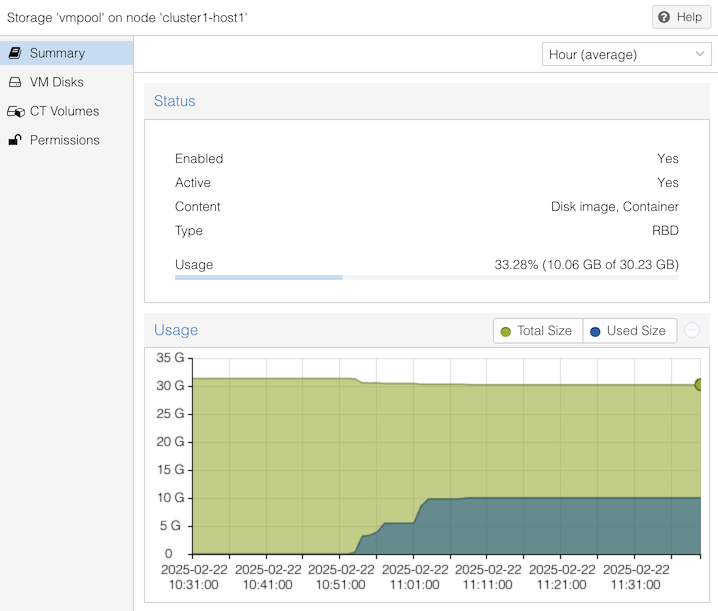
In the above example, it shows “10.06 GB of 30.23 GB” used. But understanding this is not straightforward, due to several factors:
To understand where Proxmox gets its data, you can use lower level tools:
# rbd du -p vmpool
NAME           PROVISIONED  USED
vm-100-disk-0        8 GiB  2.2 GiB
vm-101-disk-0        8 GiB  2.1 GiB
vm-102-disk-0        8 GiB  3.1 GiB
vm-103-disk-0        8 GiB  2.3 GiB
vm-111-disk-0        8 GiB      0 B
<TOTAL>             40 GiB  9.7 GiB

# ceph df
--- RAW STORAGE ---
CLASS    SIZE   AVAIL    USED  RAW USED  %RAW USED
hdd    96 GiB  64 GiB  32 GiB    32 GiB      32.99
TOTAL  96 GiB  64 GiB  32 GiB    32 GiB      32.99

--- POOLS ---
POOL    ID  PGS   STORED  OBJECTS     USED  %USED  MAX AVAIL
vmpool   1  128  9.4 GiB    2.50k   28 GiB  33.28     19 GiB
.mgr     2    1  705 KiB        2  2.1 MiB      0     19 GiB
The first command shows that 5 VM disks have been created, of size 8 GiB each, making 40 GiB which might be required. But of that space, only 9.7 GiB has been written, because of thin provisioning.
The second shows that vmpool has 9.4 GiB of stored data (ignore the small discrepancy), but this uses 28 GiB of disk space. This is due to replication.
It also says there is 19 GiB of space remaining in the pool.
Where does that figure come from? We can get more detail from the JSON format output:
# ceph df detail -f json | python3 -mjson.tool
{
...
    "pools": [
        {
            "name": "vmpool",
            "id": 1,
            "stats": {
                "stored": 10062511104,               <<<<
                "stored_data": 10062511104,
                "stored_omap": 0,
                "objects": 2500,
                "kb_used": 29480136,
                "bytes_used": 30187659264,
                "data_bytes_used": 30187659264,
                "omap_bytes_used": 0,
                "percent_used": 0.3328298032283783,  <<<<
                "max_avail": 20170776576,            <<<<
                "quota_objects": 0,
                "quota_bytes": 0,
                "dirty": 0,
                "rd": 42605,
                "rd_bytes": 970658816,
                "wr": 14748,
                "wr_bytes": 10320263168,
                "compress_bytes_used": 0,
                "compress_under_bytes": 0,
                "stored_raw": 30187532288,           <<<<
                "avail_raw": 60512331611             <<<<
            }
        },
...
“avail_raw” says there are 60,512,331,611 bytes unused in total. But because our pool has a replication factor of 3, the “max_avail” is 20,170,776,576 bytes; this is an estimate of how much more data we could store.
This agrees with the “19 GiB” summary figure shown before, when you convert it to GiB:
20170776576 / 1024 / 1024 / 1024 = 18.79 GiBSimilarly, “stored” says that there are 10,062,511,104 bytes of data stored (which is 9.37 GiB). But “stored_raw” is 3 times larger, because of replication.
Proxmox shows the pool’s “percent_used” figure, and it also estimates the total size of the pool by adding the used and available figures:
stored + max_avail
= 10062511104 + 20170776576
= 30233287680
= 30.23 GB
The fact that the total size has to be calculated in this way means that it may vary slightly over time, as the green section of the graph shows above, due to underlying ceph overheads. It could also vary for other reasons, e.g. if other pools are using the same OSDs, or if you applied or modified a pool quota.
Note that even the “percent_used” figure can be misleading, because in fact we’ve already overcommitted the storage: if all five VMs were to write to all 8GiB of their attached disks, the total data storage requirement would be 40 GiB, which is more than we can fit on the pool. Ceph would hang and block further writes when it fills.