In this lab, you’re going to configure the Ceph distribution bundled with Proxmox.
Ceph has already been downloaded, you just need to configure it.
The Ceph Mgr and Mon will run on node1; the OSDs will run on
node2-node7 using devices /dev/sdd and
/dev/sde, each of which is 8GiB.
You’ll use your normal group assignments for the OSDs:
| group | cluster/node | group | cluster/node | group | cluster/node | ||
|---|---|---|---|---|---|---|---|
| group 1 | cluster1-node2 | group 7 | cluster2-node2 | group 13 | cluster3-node2 | ||
| group 2 | cluster1-node3 | group 8 | cluster2-node3 | group 14 | cluster3-node3 | ||
| group 3 | cluster1-node4 | group 9 | cluster2-node4 | group 15 | cluster3-node4 | ||
| group 4 | cluster1-node5 | group 10 | cluster2-node5 | group 16 | cluster3-node5 | ||
| group 5 | cluster1-node6 | group 11 | cluster2-node6 | group 17 | cluster3-node6 | ||
| group 6 | cluster1-node7 | group 12 | cluster2-node7 | group 18 | cluster3-node7 |
Nominate ONE PERSON in your cluster to do this step, while the others watch
There are two ways to do this, choose one.
Open a connection to web interface of clusterX-node1.
For this to work, you must be logged in as root@pam, not
any other administrative user; if necessary, logout and log back in as
“root” in realm “Linux PAM standard authentication”
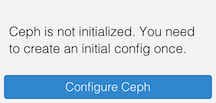
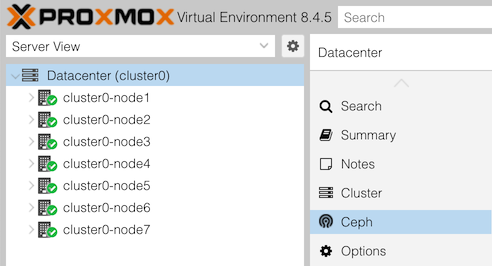
Go to “Datacenter” in the first column and “Ceph” in the second. You should see:
Click on “Configure Ceph”. This should take you to a “Configuration” screen:
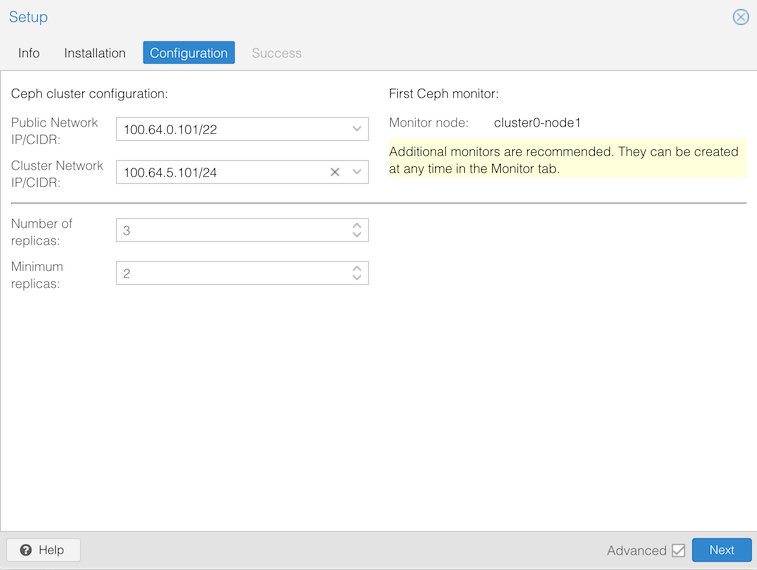
Then click Next. Hopefully the next page will say “Installation successful!”, so click Finish.
At this point you should have Ceph with one Manager and one Monitor.
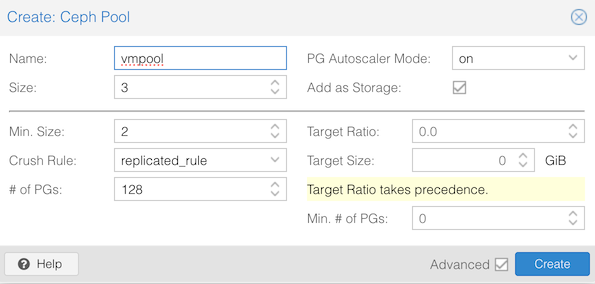
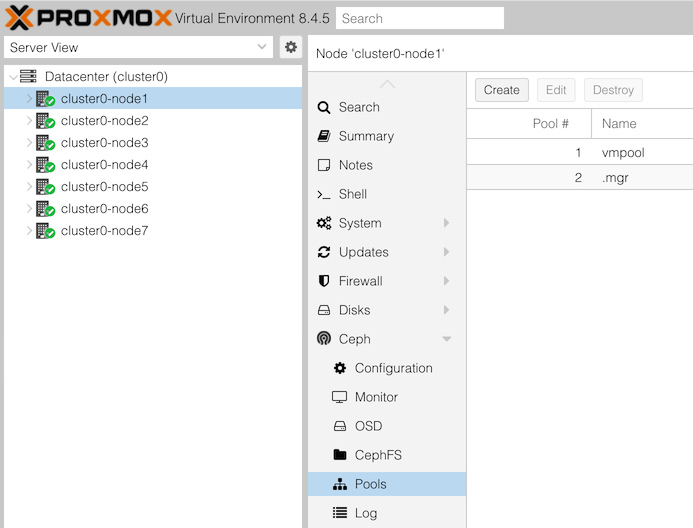
The last step is to create a Ceph pool for VM storage. Go to
clusterX-node1 in the first column, “Ceph > Pools” in
the second column. At the top click Create.
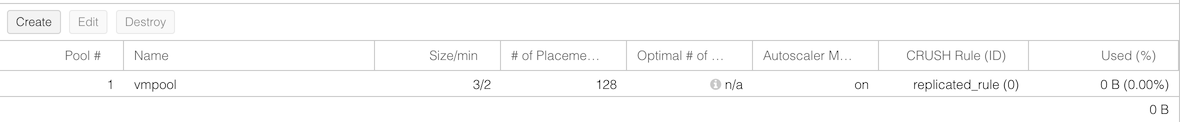
You should see your new pool:
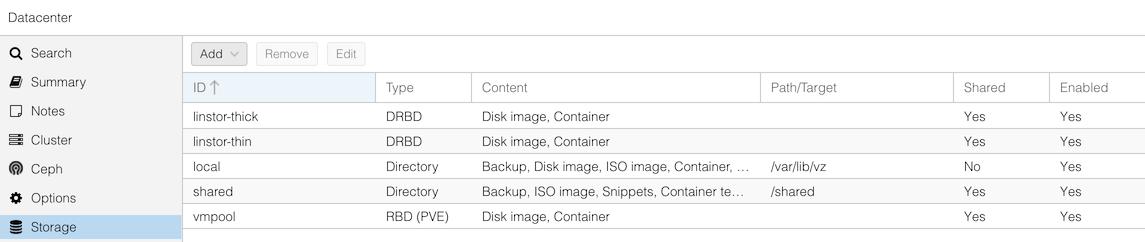
And if you go to Datacenter, Storage you should see “vmpool” added to your existing storage types:
Finally, check the status by going to “Datacenter”, “Ceph”. You’ll see health warnings, because at this point you have zero OSDs, and the minimum we’d need for a healthy cluster is three (so it could store three replicas of every piece of data)
Get a shell on node1, by selecting clusterX-node1 in the
first column and >_ Shell in the second column.
Enter the following command:
# pveceph init --network 100.64.0.0/22 --cluster-network 100.64.5.0/24
creating /etc/pve/priv/ceph.client.admin.keyring
#
Notes:
--network is used for client communication with Ceph.
Putting it on our external network allows us to expose Ceph to clients
other than Proxmox if we wish.--cluster-network is used for OSD object replication
and recovery traffic. We have assigned this to a separate backend
storage networkOther settings are left at default, but can be overridden. The
defaults include --size 3 which means we target three
replicas, and --min_size 2 which means we will permit I/O
as long as at least 2 replicas are working.
At this point, you’ll have a Ceph mgr but no mon. The next step is to create a mon:
# pveceph mon create
...
starting service 'ceph-mgr@cluster0-node1.service'
#
Finally, create a pool for VM storage:
# pveceph pool create vmpool --add_storages
skipping 'size', did not change
pool vmpool: applying application = rbd
skipping 'min_size', did not change
pool vmpool: applying pg_autoscale_mode = warn
skipping 'pg_num', did not change
Have a look at the contents of /etc/pve/storage.cfg and
you should see a new section has been added:
# cat /etc/pve/storage.cfg
...
rbd: vmpool
        content rootdir,images
        krbd 0
        pool vmpool
This is what the --add_storages flag does.
Finally, check the Ceph status:
# pveceph statusYou’ll see a health warning, because at this point you have zero OSDs, and the minimum we’d need for a healty cluster is three (so we can store three replicas of every piece of data)
At this point, split back into your separate groups to configure node2 to node7.
You are going to use /dev/sdd and /dev/sde
as OSDs for Ceph. (It is possible to use a partition or a logical
volume, but we’re going to use the entire drive)
You have a choice about how to do this. Choose either option, or if
you like, use one for sdd and one for sde.
Connect to the Proxmox web interface on any node.
Note: OSD creation requires you to be logged in as
root@pam. Check your login username at the top-right corner. If necessary you should logout, login as “root” in realm “Linux PAM standard authentication”.
In the first column, go to clusterX-nodeY. In the second
column go to Ceph, and underneath that select OSD.
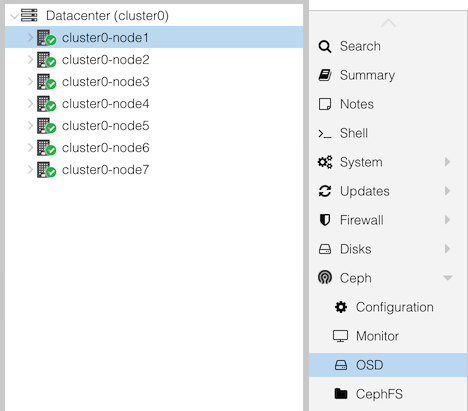
At the top click the button “Create: OSD”
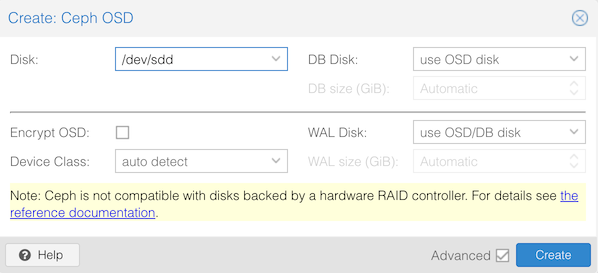
Select:
/dev/sddThen repeat for /dev/sde
Within a few seconds, the web interface under “Ceph > OSD” should show the OSDs you have added, along with OSDs on any other nodes. Each OSD gets a number starting from zero, depending on the order it was added.
Get a shell on clusterX-nodeY.
# pveceph osd create /dev/sdd
...
--> ceph-volume lvm activate successful for osd ID: 1
--> ceph-volume lvm create successful for: /dev/sdd
Repeat for /dev/sde
(Notice that Ceph bluestore configures LVM on each disk; you can see
this with pvs and vgs)
Now that you’ve added some OSDs, and probably other people have added OSDs, you can look at the state of your Ceph cluster.
Again, this can be done either via the GUI or via the CLI, and we give both options here. We suggest that in each group, one person does the GUI version and one does the CLI version, and you compare the results.
Click “Datacenter (clusterX)” in the left, and Ceph in the next column along.
You may see a health warning:
1 pools have too many placement groupsClick “+” next to this for more details:
Pool vmpool has 128 placement groups, should have 32This is a recommendation from Ceph, based on how many OSDs are available, and you will see it if the calculated “ideal” value is more than three times away from the current. Once you have enough OSDs, it should clear.
Look also at the states of the OSDs: are they “up” or “down”, and “in” or “out”? What about the monitors and managers?
The metadata server won’t be running: this is part of cephfs, the file store (as opposed to rbd block store), and it hasn’t been enabled.
Under the “Performance” section, can you see the total storage size? (Hint: it’s on a gauge).
When all OSDs are added, the cluster should have six servers (node2-7) each with 2 disks, and each disk is 8GiB. What total size does that make, and does it agree with what you see?
Note that this can be misleading, because vmpool stores three copies of each block. In that case, how much usable space do we have?
Now select “Storage” in the second column. You’ll get a list of Proxmox storage resources, one of which is “vmpool”, type RBD. The underlying storage is a Ceph pool also called “vmpool”.
To get Ceph’s view of pools, change from “Datacenter” to any individual node in the left column, then select “Ceph” in the second column, and under that “Pools”.
You should see some basic info (including utilization) of each pool.
The commands which start with “ceph” must be run on a node which is acting as a Ceph Monitor, which is currently just node1 in your cluster (you can check this in the GUI in the main Ceph status page, in a section headed “Services”).
Open a shell by selecting clusterX-node1 in the left column, and
>_ Shell in the next column.
Try these commands:
ceph health                      # current alerts
ceph healthcheck history ls      # history of alerts

pveceph pool ls                  # list all pools
pveceph pool get vmpool          # details about this pool
ceph osd pool autoscale-status   # more info about PG scaling calculations

ceph osd status                  # status of all OSDs
ceph osd tree                    # OSDs in a "tree" view, grouped by node
ceph osd perf                    # show OSD latencies (may all be zero right now)
(Note that Proxmox includes some of its own admin tools under
pveceph, but in many cases you have to use the underlying
tool ceph)
To get a rolling health check which refreshes automatically when
something changes, type ceph -w. After its initial message
it will hang waiting for a change. Hit Ctrl-C to exit it.
NOTE: before proceeding, it’s best to wait until Ceph is fully built in your cluster, where you can see 12 OSDs operational (“up” and “in”) from all six nodes
(You could import your VM data sooner. However if you do, when new OSDs are added, Ceph will need to move existing data around to “rebalance” the cluster which creates a lot of extra disk I/O activity)
For this part, find the VM which you created previously from the Ubuntu cloud image; it may be called something like “groupX-web”.
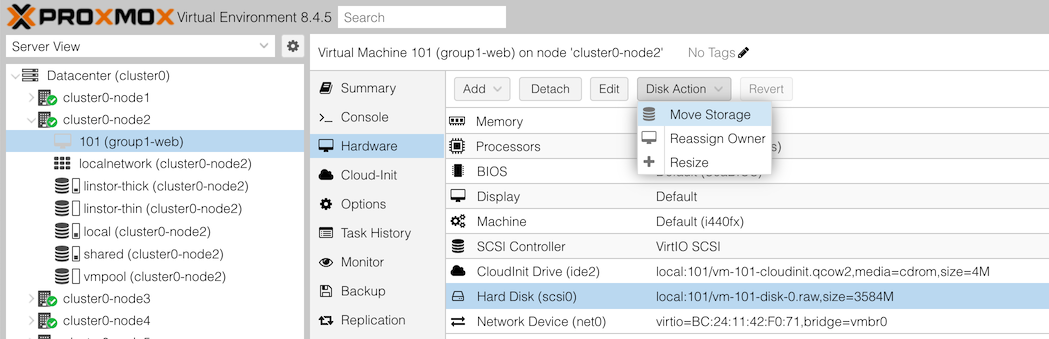
You will then get an action dialog. Select:
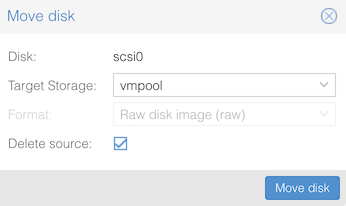
Then click “Move disk”. You should see progress as the disk contents are copied, hopefully ending with TASK OK.
NOTE: If the migration hangs, it could be because your Ceph cluster has run out of space!! Check the Ceph status page to see if this has happened. The instructor will use this as a discussion point.
If conversion completes successfully, start your VM and check it boots.
You should then remove the old disk which will appear as “Unused Disk 0” in the “Hardware” section of your VM.
Since Ceph is networked storage, you can live-migrate your VM to another node without having to copy the disk (as it’s accessible equally from anywhere in the cluster)
If you look carefully at the logs, you’ll see Proxmox is still copying the cloud-init disk. The Disk Action button is greyed out for this device, which means that you can’t move it to Ceph, but since it’s very small that doesn’t matter.
Now to look at how the cluster status has changed, as you and other groups have moved data into Ceph.
Go back to the Datacenter > Ceph summary page, and look at “Usage”. Has it increased?
Select any node in your cluster, “Ceph” in the second panel, and under that “OSDs”
This will show you the status of all the OSDs, and the percentage of storage utilization of each one. Note how the OSDs are not equally utilized. (Larger clusters will tend to balance much better than this)
Check what volumes (disk images) exist in this pool.
From the GUI: in the left column, under Datacenter, and under your cluster node, select the storage item “vmpool (clusterX-nodeY)”. Then click on “VM Disks” in the second column.
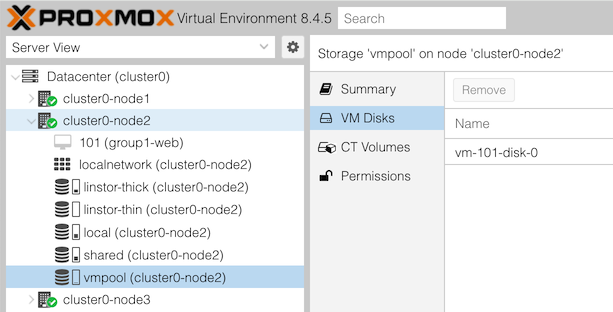
On the right, can you see the disks that you and people in other groups have created?
From the CLI:
ceph df                   # show total pool sizes
rbd ls -l -p vmpool       # which block volumes have been allocated in the pool?
rbd du -p vmpool          # show provisioned size and allocated size
Much lower-level data can be found too, for example:
ceph pg ls-by-pool vmpool # shows exactly which sets of disks each PG is held onRe-check ceph osd perf and see if you now have latency
figures for the OSDs. This table would be able to show you if you have
one disk which is performing significantly worse than the others (which
may degrade overall cluster performance, and/or may be about to
fail)
Congratulations on building and operating a Ceph cluster!
The Monitors are essential to the operation of the Ceph cluster, and in a production environment you should have either three or five. They are automatically replicated and share the load.
Create additional mons on node2 and node3 in your cluster.
You can do this in the GUI by selecting clusterX-nodeY (any node),
then Ceph > Monitor, then clicking “Create” in the
“Monitor” section, then select the node where you want to create the
mon. Or you can get a shell on the specific node and type
pveceph mon create
After a few seconds, the additional mons will appear in the GUI. You should see that all the mons have status “running”.
The Manager is not essential to the operation of the Ceph cluster. If it fails, the cluster will continue to run, although you lose the ability to update the cluster or collect statistics until you fix it.
However, it is possible to have a standby manager. Create an
additional mgr on node2, either using the GUI or by getting a shell on
node2 and running pveceph mgr create
In the GUI, you should see that the node1 mgr is “active” and the node2 mgr is “standby”.
This section is for information only.
The Proxmox web interface shows summary usage information for Ceph pools:
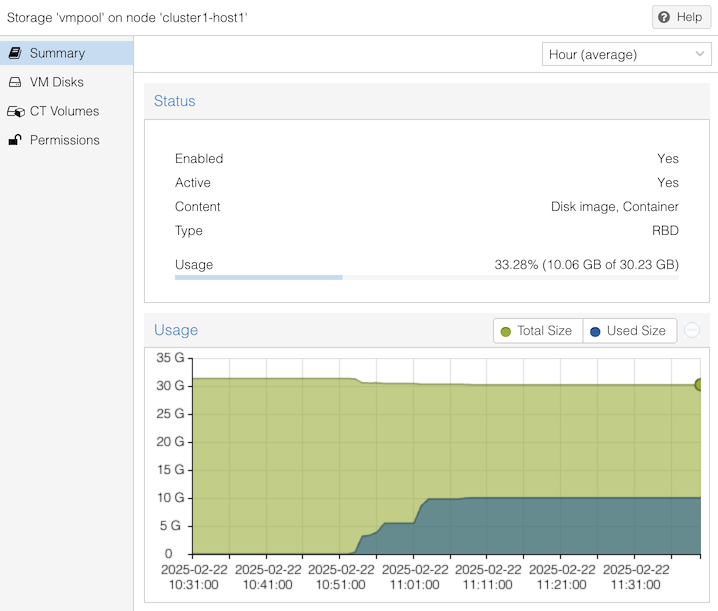
In the above example, it shows “10.06 GB of 30.23 GB” used. But understanding this is not straightforward, due to several factors:
To understand where Proxmox gets its data, you can use lower level tools. Here are some examples from a previous lab which was using VMs with 8GiB disks:
# rbd du -p vmpool
NAME           PROVISIONED  USED
vm-100-disk-0        8 GiB  2.2 GiB
vm-101-disk-0        8 GiB  2.1 GiB
vm-102-disk-0        8 GiB  3.1 GiB
vm-103-disk-0        8 GiB  2.3 GiB
vm-111-disk-0        8 GiB      0 B
<TOTAL>             40 GiB  9.7 GiB

# ceph df
--- RAW STORAGE ---
CLASS    SIZE   AVAIL    USED  RAW USED  %RAW USED
hdd    96 GiB  64 GiB  32 GiB    32 GiB      32.99
TOTAL  96 GiB  64 GiB  32 GiB    32 GiB      32.99

--- POOLS ---
POOL    ID  PGS   STORED  OBJECTS     USED  %USED  MAX AVAIL
vmpool   1  128  9.4 GiB    2.50k   28 GiB  33.28     19 GiB
.mgr     2    1  705 KiB        2  2.1 MiB      0     19 GiB
The first command shows that 5 VM disks have been created, of size 8 GiB each, making 40 GiB which might be required. But of that space, only 9.7 GiB has been written, because of thin provisioning.
The second shows that vmpool has 9.4 GiB of stored data (ignore the small discrepancy), but this uses 28 GiB of disk space. This is due to replication.
It also says there is 19 GiB of space remaining in the pool.
Where does that figure come from? We can get more detail from the JSON format output:
# ceph df detail -f json | python3 -mjson.tool
{
...
    "pools": [
        {
            "name": "vmpool",
            "id": 1,
            "stats": {
                "stored": 10062511104,               <<<<
                "stored_data": 10062511104,
                "stored_omap": 0,
                "objects": 2500,
                "kb_used": 29480136,
                "bytes_used": 30187659264,
                "data_bytes_used": 30187659264,
                "omap_bytes_used": 0,
                "percent_used": 0.3328298032283783,  <<<<
                "max_avail": 20170776576,            <<<<
                "quota_objects": 0,
                "quota_bytes": 0,
                "dirty": 0,
                "rd": 42605,
                "rd_bytes": 970658816,
                "wr": 14748,
                "wr_bytes": 10320263168,
                "compress_bytes_used": 0,
                "compress_under_bytes": 0,
                "stored_raw": 30187532288,           <<<<
                "avail_raw": 60512331611             <<<<
            }
        },
...
“avail_raw” says there are 60,512,331,611 bytes unused in total. But because our pool has a replication factor of 3, the “max_avail” is 20,170,776,576 bytes; this is an estimate of how much more data we could store.
This agrees with the “19 GiB” summary figure shown before, when you convert it to GiB:
20170776576 / 1024 / 1024 / 1024 = 18.79 GiBSimilarly, “stored” says that there are 10,062,511,104 bytes of data stored (which is 9.37 GiB). But “stored_raw” is 3 times larger, because of replication.
Proxmox shows the pool’s “percent_used” figure, and it also estimates the total size of the pool by adding the used and available figures:
stored + max_avail
= 10062511104 + 20170776576
= 30233287680
= 30.23 GB
The fact that the total size has to be calculated in this way means that it may vary slightly over time, as the green section of the graph shows above, due to underlying Ceph overheads. It could also vary for other reasons, e.g. if other pools are using the same OSDs, or you applied or modified a pool quota.
Note that even the “percent_used” figure can be misleading, because in fact we’ve already overcommitted the storage: if all five VMs were to write to all 8GiB of their attached disks, the total data storage requirement would be 40 GiB (= 120 GiB with replication), which is more than we can fit on the pool. Ceph would hang and block further writes when it fills.
It is possible for VMs to mount a Cephfs filesystem, and share data. This provides a distributed filesystem similar in concept to NFS, but not dependent on a single file server.
The following is just a proof-of-concept for demonstrating this in action. Setting it up properly in a secure and scalable manner requires more work.
(Just one person does this)
In the GUI, go to clusterX-node1, Ceph > CephFS.
Under Metadata Servers, click Create. Select clusterX-node1, MDS ID “clusterX-node1”, and click Create.
For this demo, a single MDS server is all that’s needed.
At the top of the page, click “Create CephFS”. Use the default name “cephfs”. (Only one instance can be created anyway).
If you see this error:
TASK ERROR: adding storage for CephFS ‘cephfs’ failed, check log and add manually! create storage failed: mount error: Job failed. See “journalctl -xe” for details.
you can ignore it. This is a limitation of how node1 is built in the lab environment.
(Do this in each of the groupX-web VMs which want to
share data)
Get a root shell inside the groupX-web VM.
Install the ceph-common package:
apt install ceph-common
Now, you will need to create two files,
/etc/ceph/ceph.conf and
/etc/ceph/admin.keyring. These will need to include some
values taken from node1, so you’ll need a shell on node1 too.
On node1, cat /etc/pve/ceph.conf
Now in the groupX-web VM, create a
/etc/ceph/ceph.conf which is similar to the first part of
that file:
[global]
    auth_client_required = cephx
    auth_cluster_required = cephx
    auth_service_required = cephx
    cluster_network = 100.64.5.0/24
    fsid = 51d25a52-e9ba-4366-a338-53216fb3b1a5   << UPDATE
    mon_allow_pool_delete = true
    mon_host = 100.64.0.101                       << UPDATE
    ms_bind_ipv4 = true
    ms_bind_ipv6 = false
    osd_pool_default_min_size = 2
    osd_pool_default_size = 3
    public_network = 100.64.0.0/22

[client]
    keyring = /etc/ceph/admin.keyring             << NOTE: This is different
Next on node1,
cat /etc/pve/priv/ceph.client.admin.keyring
It will look something like this:
[client.admin]
    key = AQAKbYdoJ7UaJRAA6kz7KOk7N8OniptaHve0Qw==
    caps mds = "allow *"
    caps mgr = "allow *"
    caps mon = "allow *"
    caps osd = "allow *"
Take the part after “key =” and put it by itself in a file called
/etc/ceph/admin.keyring in the groupX-web VM. That is, just
this part:
AQAKbYdoJ7UaJRAA6kz7KOk7N8OniptaHve0Qw==Finally, on groupX-web, mount the filesystem:
mount -t ceph admin@51d25a52-e9ba-4366-a338-53216fb3b1a5.cephfs=/ /mnt/cephfs -o 'secretfile=/etc/ceph/admin.keyring,mon_addr=100.64.0.101'You will need to change the part after “admin@” to be the “fsid” from
ceph.conf, and the mon_addr to match mon_host.
If there are multiple IP addresses, separate them with slashes.
If all is good, the mount should succeed. You can create a file, and it should be visible in other VMs which also have it mounted.
touch /mnt/cephfs/testfile
ls /mnt/cephfs