Web Server Statistics for ISOC Workshop Resource CentreProgram started on Fri, Apr 02 2010 at 4:52 AM.
Analyzed requests from Thu, Apr 01 2010 at 4:54 AM to Thu, Apr 01 2010 at 8:50 AM (0.16 days).
(Go To: Top | General Summary | Daily Report | Daily Summary | Hourly Summary | Domain Report | Organization Report | Host Report | Status Code Report | File Size Report | File Type Report | Directory Report | Failure Report | Request Report)
This report contains overall statistics.
Successful requests: 907
Average successful requests per day: 5,528
Successful requests for pages: 342
Average successful requests for pages per day: 2,080
Failed requests: 135
Redirected requests: 22
Distinct files requested: 540
Distinct hosts served: 252
Corrupt logfile lines: 1
Unwanted logfile entries: 32,118
Data transferred: 307.66 megabytes
Average data transferred per day: 1.83 gigabytes
(Go To: Top | General Summary | Daily Report | Daily Summary | Hourly Summary | Domain Report | Organization Report | Host Report | Status Code Report | File Size Report | File Type Report | Directory Report | Failure Report | Request Report)
This report lists the activity in each day.
Each unit (
) represents 10 requests for pages or part thereof.
| date | #reqs | #pages | |
|---|---|---|---|
| Apr/ 1/10 | 907 | 342 | ![]() ![]() ![]() |
Busiest day: Apr/ 1/10 (342 requests for pages).
(Go To: Top | General Summary | Daily Report | Daily Summary | Hourly Summary | Domain Report | Organization Report | Host Report | Status Code Report | File Size Report | File Type Report | Directory Report | Failure Report | Request Report)
This report lists the total activity for each day of the week, summed over all the weeks in the report.
Each unit (
) represents 8 requests for pages or part thereof.
| day | #reqs | #pages | |
|---|---|---|---|
| Sun | 0 | 0 | |
| Mon | 0 | 0 | |
| Tue | 0 | 0 | |
| Wed | 0 | 0 | |
| Thu | 907 | 342 | ![]() ![]() ![]() ![]() |
| Fri | 0 | 0 | |
| Sat | 0 | 0 |
(Go To: Top | General Summary | Daily Report | Daily Summary | Hourly Summary | Domain Report | Organization Report | Host Report | Status Code Report | File Size Report | File Type Report | Directory Report | Failure Report | Request Report)
This report lists the total activity for each hour of the day, summed over all the days in the report.
Each unit (
) represents 4 requests for pages or part thereof.
| hour | #reqs | #pages | |
|---|---|---|---|
| 0 | 0 | 0 | |
| 1 | 0 | 0 | |
| 2 | 0 | 0 | |
| 3 | 0 | 0 | |
| 4 | 20 | 5 | ![]() |
| 5 | 169 | 49 | ![]() ![]() ![]() |
| 6 | 250 | 101 | ![]() ![]() ![]() |
| 7 | 272 | 143 | ![]() ![]() |
| 8 | 196 | 44 | ![]() ![]() ![]() |
| 9 | 0 | 0 | |
| 10 | 0 | 0 | |
| 11 | 0 | 0 | |
| 12 | 0 | 0 | |
| 13 | 0 | 0 | |
| 14 | 0 | 0 | |
| 15 | 0 | 0 | |
| 16 | 0 | 0 | |
| 17 | 0 | 0 | |
| 18 | 0 | 0 | |
| 19 | 0 | 0 | |
| 20 | 0 | 0 | |
| 21 | 0 | 0 | |
| 22 | 0 | 0 | |
| 23 | 0 | 0 |
(Go To: Top | General Summary | Daily Report | Daily Summary | Hourly Summary | Domain Report | Organization Report | Host Report | Status Code Report | File Size Report | File Type Report | Directory Report | Failure Report | Request Report)
This report lists the countries of the computers which requested files.

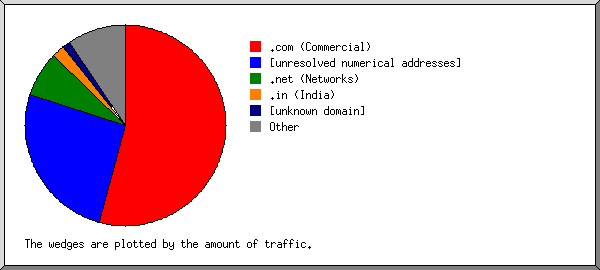
Listing domains, sorted by the amount of traffic.
| #reqs | %bytes | domain |
|---|---|---|
| 282 | 75.44% | .com (Commercial) |
| 157 | 10.92% | [unresolved numerical addresses] |
| 46 | 2.61% | .net (Networks) |
| 54 | 2.08% | .mx (Mexico) |
| 4 | 1.80% | .ca (Canada) |
| 18 | 1.17% | .ru (Russia) |
| 2 | 1.10% | .es (Spain) |
| 1 | 0.85% | .fi (Finland) |
| 13 | 0.65% | .np (Nepal) |
| 152 | 0.57% | .org (Non Profit Making Organizations) |
| 1 | 0.42% | .pl (Poland) |
| 12 | 0.36% | .ar (Argentina) |
| 6 | 0.28% | .in (India) |
| 2 | 0.21% | .id (Indonesia) |
| 8 | 0.21% | .sg (Singapore) |
| 1 | 0.21% | .arpa (Arpanet) |
| 24 | 0.19% | .nl (Netherlands) |
| 3 | 0.14% | .fr (France) |
| 10 | 0.13% | .co (Colombia) |
| 1 | 0.13% | .ch (Switzerland) |
| 67 | 0.11% | .se (Sweden) |
| 2 | 0.08% | .do (Dominican Republic) |
| 2 | 0.07% | .de (Germany) |
| 9 | 0.06% | .it (Italy) |
| 11 | 0.05% | .br (Brazil) |
| 1 | 0.04% | .ua (Ukraine) |
| 2 | 0.04% | .uk (United Kingdom) |
| 2 | 0.03% | .hu (Hungary) |
| 1 | 0.01% | .bw (Botswana) |
| 3 | 0.01% | .ug (Uganda) |
| 6 | 0.01% | .info (Informational) |
| 1 | .pt (Portugal) | |
| 1 | .is (Iceland) | |
| 1 | .cl (Chile) | |
| 1 | [domain not given] |
(Go To: Top | General Summary | Daily Report | Daily Summary | Hourly Summary | Domain Report | Organization Report | Host Report | Status Code Report | File Size Report | File Type Report | Directory Report | Failure Report | Request Report)
This report lists the organizations of the computers which requested files.

Listing the top 20 organizations by the number of requests, sorted by the number of requests.
| #reqs | %bytes | organization |
|---|---|---|
| 166 | 68.87% | msn.com |
| 105 | 0.42% | dotnetdotcom.org |
| 67 | 0.11% | comhem.se |
| 52 | 0.64% | googlebot.com |
| 47 | 0.15% | nsrc.org |
| 40 | 1.04% | cablevision.net.mx |
| 28 | 0.09% | 123 |
| 24 | 0.19% | rodecker.nl |
| 22 | 0.65% | 41 |
| 19 | 1.93% | 65.55 |
| 16 | 0.75% | yandex.ru |
| 15 | 0.20% | satgate.net |
| 14 | 1.05% | prodigy.net.mx |
| 13 | 0.65% | np |
| 13 | 0.04% | as13448.com |
| 13 | 1.45% | baidu.com |
| 12 | 0.01% | 202.67 |
| 10 | 0.13% | etb.net.co |
| 9 | 0.04% | gvt.net.br |
| 9 | 0.19% | telecom.net.ar |
| 213 | 21.41% | [not listed: 99 organizations] |
(Go To: Top | General Summary | Daily Report | Daily Summary | Hourly Summary | Domain Report | Organization Report | Host Report | Status Code Report | File Size Report | File Type Report | Directory Report | Failure Report | Request Report)
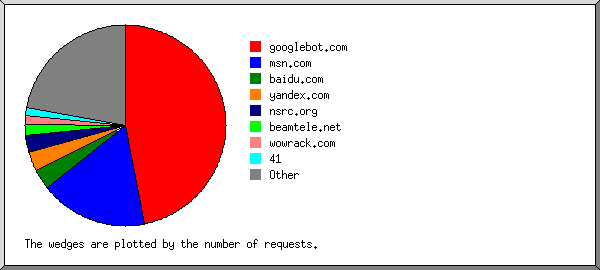
This report lists the computers which requested files.

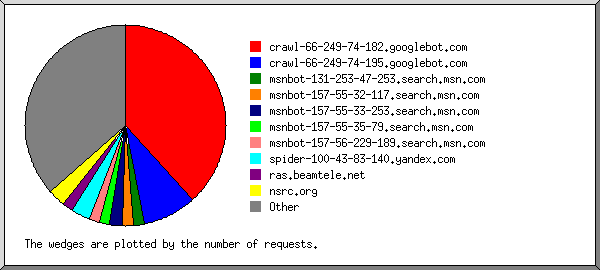
Listing the top 50 hosts by the number of requests, sorted alphabetically.
| #reqs | %bytes | host |
|---|---|---|
| 10 | 41.207.162.5 | |
| 6 | 0.24% | 41.230.224.239 |
| 4 | 0.77% | 65.55.108.138 |
| 5 | 0.20% | 65.55.218.174 |
| 4 | 1.06% | 66.231.252.10 |
| 3 | 0.03% | 80.70.32.102 |
| 6 | 0.36% | 81.29.102.108 |
| 5 | 0.06% | 82.151.74.124 |
| 28 | 0.09% | 123.20.190.239 |
| 5 | 193.188.66.71 | |
| 6 | 0.18% | 196.213.221.234 |
| 12 | 0.01% | 202.67.6.11 |
| 8 | 0.47% | 204.29.106.254 |
| 9 | 0.19% | host129.190-137-42.telecom.net.ar |
| 9 | 0.04% | alternativaeditorial34.static.gvt.net.br |
| 4 | 1.80% | ottawa-hs-64-26-128-202.s-ip.magma.ca |
| 10 | 0.13% | corporat190-024223046.sta.etb.net.co |
| 8 | 0.01% | 41.220.117.222.accesskenya.com |
| 4 | 0.82% | ac815df3.ipt.aol.com |
| 13 | 0.04% | static-208-80-193-41.as13448.com |
| 4 | 0.01% | 77.241.83.107.static.hosted.by.combell.com |
| 5 | crawl-66-249-67-35.googlebot.com | |
| 47 | 0.64% | crawl-66-249-67-57.googlebot.com |
| 8 | 0.01% | host63.fobsky63.juch-tech.com |
| 3 | 0.01% | msnbot-207-46-13-132.search.msn.com |
| 3 | 0.07% | msnbot-207-46-13-91.search.msn.com |
| 3 | 0.04% | msnbot-207-46-13-97.search.msn.com |
| 4 | 0.28% | msnbot-207-46-195-230.search.msn.com |
| 4 | 0.08% | msnbot-207-46-195-235.search.msn.com |
| 3 | 0.50% | msnbot-207-46-199-44.search.msn.com |
| 6 | 0.29% | msnbot-207-46-199-48.search.msn.com |
| 3 | msnbot-207-46-204-178.search.msn.com | |
| 3 | 0.17% | msnbot-207-46-204-228.search.msn.com |
| 4 | 0.82% | msnbot-65-55-216-71.search.msn.com |
| 3 | 0.06% | pun.dsl.static-61.17.76-124.vsnl.net.in |
| 6 | 0.01% | s15349734.onlinehome-server.info |
| 8 | 0.03% | host221-153-dynamic.51-82-r.retail.telecomitalia.it |
| 40 | 1.04% | customer-189-216-138-175.cablevision.net.mx |
| 14 | 1.05% | dup-200-66-144-122.prodigy.net.mx |
| 15 | 0.20% | 77.94.37.31.satgate.net |
| 4 | 0.01% | 177-80-112-92.pool.ukrtel.net |
| 24 | 0.19% | nienna.rodecker.nl |
| 13 | 0.65% | 47-adsl.ntc.net.np |
| 105 | 0.42% | crawl9.dotnetdotcom.org |
| 47 | 0.15% | nsrc.org |
| 16 | 0.75% | spider05.yandex.ru |
| 16 | 0.05% | c80-216-254-79.bredband.comhem.se |
| 51 | 0.06% | c80-217-231-1.bredband.comhem.se |
| 7 | 0.21% | cm14.omega8.maxonline.com.sg |
| 3 | 0.01% | static188-metronet.infocom.co.ug |
| 276 | 85.67% | [not listed: 202 hosts] |
(Go To: Top | General Summary | Daily Report | Daily Summary | Hourly Summary | Domain Report | Organization Report | Host Report | Status Code Report | File Size Report | File Type Report | Directory Report | Failure Report | Request Report)
This report lists the HTTP status codes of all requests.

Listing status codes, sorted numerically.
| #reqs | status code |
|---|---|
| 689 | 200 OK |
| 110 | 206 Partial content |
| 10 | 301 Document moved permanently |
| 12 | 302 Document found elsewhere |
| 108 | 304 Not modified since last retrieval |
| 2 | 403 Access forbidden |
| 133 | 404 Document not found |
(Go To: Top | General Summary | Daily Report | Daily Summary | Hourly Summary | Domain Report | Organization Report | Host Report | Status Code Report | File Size Report | File Type Report | Directory Report | Failure Report | Request Report)
This report lists the sizes of files.

| size | #reqs | %bytes |
|---|---|---|
| 0 | 124 | |
| 1B- 10B | 0 | |
| 11B- 100B | 2 | |
| 101B- 1kB | 73 | 0.01% |
| 1kB- 10kB | 252 | 0.33% |
| 10kB-100kB | 300 | 2.52% |
| 100kB- 1MB | 116 | 12.51% |
| 1MB- 10MB | 39 | 24.79% |
| 10MB-100MB | 0 | |
| 100MB- 1GB | 1 | 59.83% |
(Go To: Top | General Summary | Daily Report | Daily Summary | Hourly Summary | Domain Report | Organization Report | Host Report | Status Code Report | File Size Report | File Type Report | Directory Report | Failure Report | Request Report)
This report lists the extensions of files.

Listing extensions with at least 0.1% of the traffic, sorted by the amount of traffic.
| #reqs | %bytes | extension |
|---|---|---|
| 1 | 59.83% | .iso |
| 190 | 24.14% | .pdf [Adobe Portable Document Format] |
| 70 | 8.35% | .ppt |
| 18 | 2.13% | .jpeg [JPEG graphics] |
| 22 | 1.63% | .png [PNG graphics] |
| 49 | 0.87% | .php [PHP] |
| 24 | 0.59% | .jpg [JPEG graphics] |
| 226 | 0.52% | [directories] |
| 4 | 0.41% | .JPG |
| 103 | 0.39% | .html [Hypertext Markup Language] |
| 27 | 0.33% | .ics |
| 23 | 0.28% | .txt [Plain text] |
| 3 | 0.10% | .sxi |
| 147 | 0.43% | [not listed: 17 extensions] |
(Go To: Top | General Summary | Daily Report | Daily Summary | Hourly Summary | Domain Report | Organization Report | Host Report | Status Code Report | File Size Report | File Type Report | Directory Report | Failure Report | Request Report)
This report lists the directories from which files were requested. (The figures for each directory include all of its subdirectories.)

Listing directories with at least 0.01% of the traffic, sorted by the amount of traffic.
| #reqs | %bytes | directory |
|---|---|---|
| 300 | 73.55% | /workshops/ |
| 257 | 24.43% | /data/ |
| 8 | 0.72% | /materials/ |
| 32 | 0.39% | /calendar/ |
| 111 | 0.35% | [root directory] |
| 36 | 0.27% | /analog/ |
| 30 | 0.07% | /helpfiles/ |
| 7 | 0.05% | /usage/ |
| 3 | 0.05% | /search/ |
| 34 | 0.03% | /images/ |
| 10 | 0.01% | /peer-review/ |
| 12 | 0.01% | /mailman/ |
| 6 | 0.01% | /css/ |
| 11 | 0.01% | /scripts/ |
| 50 | 0.02% | [not listed: 7 directories] |
(Go To: Top | General Summary | Daily Report | Daily Summary | Hourly Summary | Domain Report | Organization Report | Host Report | Status Code Report | File Size Report | File Type Report | Directory Report | Failure Report | Request Report)
This report lists the files that caused failures, for example files not found.

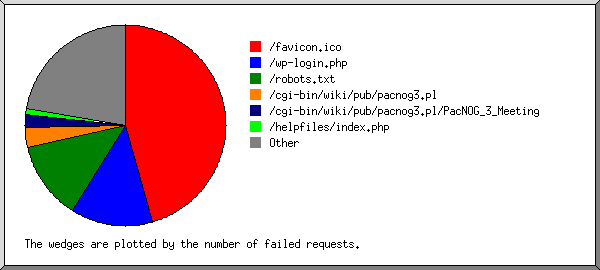
Listing files, sorted by the number of failed requests.
| #reqs | file |
|---|---|
| 60 | /favicon.ico |
| 29 | /robots.txt |
| 7 | /_vti_bin/shtml.exe/_vti_rpc |
| 7 | /_vti_inf.html |
| 3 | /update.php |
| 3 | /scripts/vwar/backup/errors.php |
| 3 | /vwar/backup/errors.php |
| 2 | /workshops/2005/ccTLD-Nairobi/http |
| 1 | /workshops/2004/CEDIA/presentaciones/bc/correo/courier |
| 1 | /data/2005/75283141045ae1b2ee5c80/lesbian.html |
| 1 | /usage/usage_200901.html/admin.php |
| 1 | /cgi-bin/wiki/pub/sn-cctld.pl |
| 1 | /workshops/2004/ccTLD-Amsterdam/dnssec/ISOC_tld_2004.pdf |
| 1 | /data/2010/15678359774b67528c8924a/lecture-02-wed-layer2-vlans.pdf |
| 1 | /data/2005/75283141045ae1b2ee5c80/gay.html |
| 1 | /scripts/errors.php /vwar/backup/errors.php |
| 1 | /usage/admin.php |
| 1 | /main.php |
| 1 | /workshops/2007/ccTLD-Guyana/day4/ws-cctld-resources.html |
| 1 | /admin.php |
| 1 | /workshops/2004/SANOG-IV/ip-services/presentations/ssl/ |
| 1 | /workshops/2004/SANOG-IV/ip-services/presentations/security/ |
| 1 | /workshops/2008/walc/presentaciones/presentaciones/documentacion_netdot.pdf |
| 1 | /data/2006/268951484448218270eea0/apache_postinstall/apache-postinstall.html |
| 1 | /materials/source.php /main.php |
| 1 | /tlds/new-tld-application-instructions-15aug00.htm |
| 1 | /materials/main.php |
| 1 | /data/2005/75283141045ae1b2ee5c80/porn.html |
| 1 | /data/2003/375477389400b720e03aa2/DCC7128EFE97A1D145AC84D14DE461DA_00000.temp0008.htm |
(Go To: Top | General Summary | Daily Report | Daily Summary | Hourly Summary | Domain Report | Organization Report | Host Report | Status Code Report | File Size Report | File Type Report | Directory Report | Failure Report | Request Report)
This report lists the files on the site.

Listing files with at least 20 requests, sorted by the number of requests.
| #reqs | %bytes | last time | file |
|---|---|---|---|
| 108 | 0.35% | Apr/ 1/10 8:46 AM | / |
| 54 | 2.08% | Apr/ 1/10 8:32 AM | /data/2004/1797176210448267ca02e17/IPv6.pdf |
| 25 | 0.20% | Apr/ 1/10 8:48 AM | /calendar/ical/wrc-upcoming.ics |
| 720 | 97.37% | Apr/ 1/10 8:50 AM | [not listed: 503 files] |