(Go To: Top | General Summary | Daily Report | Daily Summary | Hourly Summary | Domain Report | Organization Report | Host Report | Status Code Report | File Size Report | File Type Report | Directory Report | Failure Report | Request Report)
This report lists the countries of the computers which requested files.
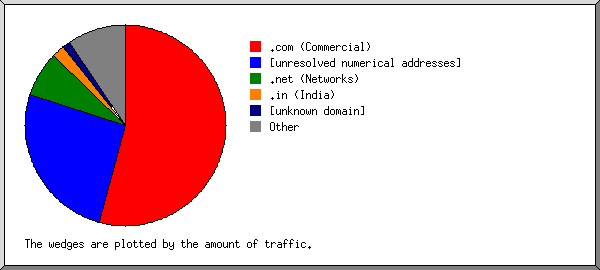
Listing domains, sorted by the amount of traffic.
| #reqs | %bytes | domain |
|---|
| 1601 | 34.71% | .net (Networks) |
| 962 | 21.82% | [unresolved numerical addresses] |
| 1200 | 18.79% | .ru (Russia) |
| 3225 | 10.91% | .com (Commercial) |
| 56 | 3.20% | .se (Sweden) |
| 94 | 1.45% | .mx (Mexico) |
| 90 | 0.92% | .in (India) |
| 88 | 0.90% | .co (Colombia) |
| 49 | 0.88% | .ca (Canada) |
| 878 | 0.74% | .org (Non Profit Making Organizations) |
| 108 | 0.68% | .ar (Argentina) |
| 16 | 0.50% | .fr (France) |
| 26 | 0.50% | .uk (United Kingdom) |
| 7 | 0.37% | .es (Spain) |
| 13 | 0.33% | .edu (US Higher Education) |
| 5 | 0.32% | .gt (Guatemala) |
| 13 | 0.31% | .pk (Pakistan) |
| 32 | 0.29% | .lt (Lithuania) |
| 1 | 0.27% | .ni (Nicaragua) |
| 4 | 0.25% | .my (Malaysia) |
| 9 | 0.23% | .pe (Peru) |
| 38 | 0.20% | .jp (Japan) |
| 10 | 0.19% | .au (Australia) |
| 2 | 0.17% | .tz (Tanzania) |
| 3 | 0.15% | .cl (Chile) |
| 11 | 0.08% | .arpa (Arpanet) |
| 12 | 0.08% | .bo (Bolivia) |
| 5 | 0.08% | .de (Germany) |
| 67 | 0.06% | .nl (Netherlands) |
| 3 | 0.05% | .do (Dominican Republic) |
| 9 | 0.05% | .us (United States) |
| 8 | 0.04% | .vn (Vietnam) |
| 2 | 0.04% | .ve (Venezuela) |
| 2 | 0.04% | .sg (Singapore) |
| 13 | 0.04% | .ec (Ecuador) |
| 5 | 0.03% | .gov (US Government) |
| 3 | 0.03% | .br (Brazil) |
| 1 | 0.03% | .ma (Morocco) |
| 6 | 0.02% | .id (Indonesia) |
| 7 | 0.02% | .it (Italy) |
| 1 | 0.02% | .hu (Hungary) |
| 4 | 0.02% | .ro (Romania) |
| 1 | 0.02% | .ir (Iran) |
| 2 | 0.02% | .py (Paraguay) |
| 5 | 0.02% | .be (Belgium) |
| 1203 | 0.02% | .ua (Ukraine) |
| 1 | 0.01% | .pl (Poland) |
| 2 | 0.01% | .ph (Philippines) |
| 1 | 0.01% | .sy (Syria) |
| 3 | 0.01% | .ci (Ivory Coast) |
| 13 | 0.01% | .sk (Slovakia) |
| 1 | 0.01% | .cd (Democratic Republic of the Congo) |
| 5 | 0.01% | .fi (Finland) |
| 1 | 0.01% | .mil (US Military) |
| 1 | 0.01% | .lk (Sri Lanka) |
| 1 | | [unknown domain] |
| 2 | | .sl (Sierra Leone) |
| 1 | | .tv (Tuvalu) |
| 1 | | .th (Thailand) |
| 3 | | .md (Moldova) |
| 4 | | .cz (Czech Republic) |
| 19 | | [domain not given] |
| 2 | | .il (Israel) |
| 2 | | .bm (Bermuda) |
| 2 | | .pt (Portugal) |
| 1 | | .za (South Africa) |
| 2 | | .dk (Denmark) |
| 1 | | .ch (Switzerland) |
| 1 | | .mg (Madagascar) |
| 1 | | .ke (Kenya) |
(Go To: Top | General Summary | Daily Report | Daily Summary | Hourly Summary | Domain Report | Organization Report | Host Report | Status Code Report | File Size Report | File Type Report | Directory Report | Failure Report | Request Report)
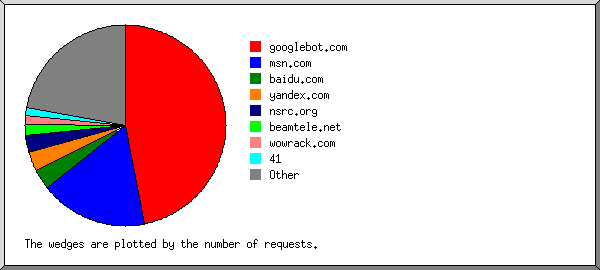
This report lists the computers which requested files.
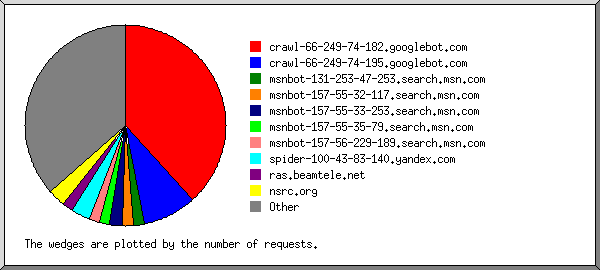
Listing the top 50 hosts by the number of requests, sorted alphabetically.
| #reqs | %bytes | host |
|---|
| 38 | 0.01% | 12.197.38.130 |
| 28 | 0.59% | 38.101.148.126 |
| 27 | 0.21% | 41.140.104.103 |
| 16 | 0.13% | 41.249.47.144 |
| 15 | 0.03% | 65.167.28.98 |
| 18 | | 74.198.28.212 |
| 22 | | 86.57.87.5 |
| 24 | 0.12% | 190.129.68.171 |
| 16 | 0.04% | 190.130.43.59 |
| 57 | 0.48% | 190.252.160.208 |
| 28 | 0.83% | 196.12.32.244 |
| 18 | 0.05% | 200.27.226.142 |
| 23 | 0.18% | 200.55.149.13 |
| 20 | 0.05% | 200.125.193.34 |
| 28 | 0.04% | 201-250-84-128.speedy.com.ar |
| 31 | 0.15% | host242.190-228-110.telecom.net.ar |
| 30 | 0.01% | dh20.r2.owls.hopcount.ca |
| 16 | 0.04% | dynamic-ip-1868613189.cable.net.co |
| 24 | 0.07% | adsl190-28-211-52.epm.net.co |
| 20 | 0.02% | adsl190-24142018.sta.etb.net.co |
| 28 | 0.36% | beware-of-dogs.calyopea.com |
| 17 | 0.01% | 24-231-200-154.dhcp.bycy.mi.charter.com |
| 2490 | 4.63% | crawl-66-249-67-4.googlebot.com |
| 301 | 1.25% | msnbot-65-55-3-172.search.msn.com |
| 23 | 0.63% | 92.be.1343.static.theplanet.com |
| 30 | 0.07% | cpc4-nfds13-2-0-cust646.8-2.cable.virginmedia.com |
| 16 | | dmocjz |
| 36 | 0.01% | abts-tn-dynamic-146.100.174.122.airtelbroadband.in |
| 28 | 0.18% | p1136-ipbf2306hodogaya.kanagawa.ocn.ne.jp |
| 31 | 0.29% | client-87-247-97-97.inturbo.lt |
| 20 | 0.19% | dsl-189-130-20-211-dyn.prod-infinitum.com.mx |
| 17 | 0.20% | dslb-088-070-039-024.pools.arcor-ip.net |
| 49 | 0.03% | dsdf-4d0a0e6f.pool.mediaways.net |
| 17 | 0.13% | mobile-166-137-136-011.mycingular.net |
| 21 | | mobile-166-137-137-250.mycingular.net |
| 349 | 2.20% | ns360454.ovh.net |
| 19 | | 75-161-217-136.mpls.qwest.net |
| 16 | 0.01% | pool-71-116-89-172.snfcca.dsl-w.verizon.net |
| 30 | 0.26% | pool-173-79-106-148.washdc.fios.verizon.net |
| 829 | 28.47% | b3090969.crawl.yahoo.net |
| 42 | 0.05% | nienna.rodecker.nl |
| 20 | 0.01% | s5591a50e.adsl.wanadoo.nl |
| 545 | 0.55% | crawl9.dotnetdotcom.org |
| 21 | 0.03% | swan.lax.dns.icann.org |
| 288 | 0.17% | nsrc.org |
| 24 | | us.stpsb.org |
| 1189 | 18.45% | spider05.yandex.ru |
| 424 | | utel4.in.ua |
| 546 | | s40.org.ua |
| 226 | | server37.org.ua |
| 1780 | 38.75% | [not listed: 758 hosts] |
(Go To: Top | General Summary | Daily Report | Daily Summary | Hourly Summary | Domain Report | Organization Report | Host Report | Status Code Report | File Size Report | File Type Report | Directory Report | Failure Report | Request Report)
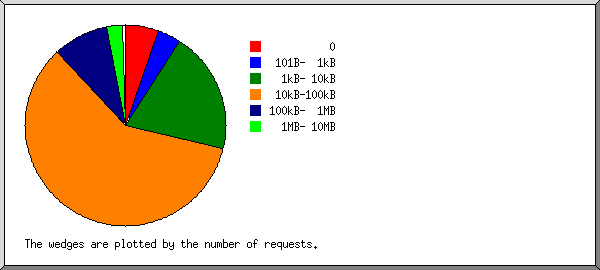
This report lists the extensions of files.

Listing extensions with at least 0.1% of the traffic, sorted by the amount of traffic.
| #reqs | %bytes | extension |
|---|
| 3 | 38.45% | .iso |
| 1111 | 30.10% | .pdf [Adobe Portable Document Format] |
| 502 | 13.60% | .ppt |
| 46 | 3.94% | .pptx |
| 2696 | 3.53% | .html [Hypertext Markup Language] |
| 2119 | 3.21% | .pl [Perl scripts] |
| 62 | 1.70% | .odp |
| 54 | 1.23% | .png [PNG graphics] |
| 12 | 1.01% | .gz [Gzip compressed files] |
| 6 | 0.96% | .tar.gz [Compressed archives] |
| 204 | 0.55% | .ics |
| 1720 | 0.54% | [directories] |
| 239 | 0.34% | .php [PHP] |
| 183 | 0.29% | .jpg [JPEG graphics] |
| 14 | 0.25% | .odt |
| 1 | 0.23% | .avi [AVI movies] |
| 11 | 0.22% | .PDF |
| 88 | 0.19% | .txt [Plain text] |
| 14 | 0.17% | .doc [Microsoft Word document] |
| 24 | 0.14% | .sxi |
| 868 | 0.32% | [not listed: 28 extensions] |
(Go To: Top | General Summary | Daily Report | Daily Summary | Hourly Summary | Domain Report | Organization Report | Host Report | Status Code Report | File Size Report | File Type Report | Directory Report | Failure Report | Request Report)
This report lists the files that caused failures, for example files not found.
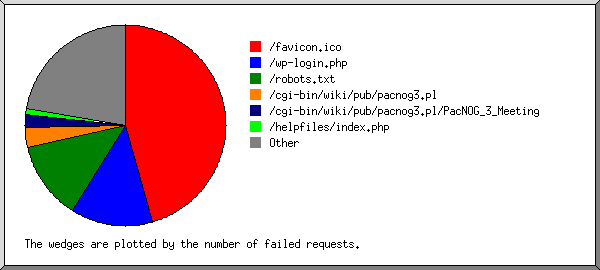
Listing the top 30 files by the number of failed requests, sorted by the number of failed requests.
| #reqs | file |
|---|
| 408 | /favicon.ico |
| 86 | /robots.txt |
| 37 | /index2.php |
| 37 | /index2.php?option=com_gcalendar&controller=../../../../../../../../../../../../../../../proc/self/environ%00 |
| 30 | /calendar/ical/index2.php |
| 30 | /calendar/ical/index2.php?option=com_gcalendar&controller=../../../../../../../../../../../../../../../proc/self/environ%00 |
| 30 | /calendar/index2.php |
| 30 | /calendar/index2.php?option=com_gcalendar&controller=../../../../../../../../../../../../../../../proc/self/environ%00 |
| 12 | /_vti_bin/shtml.exe/_vti_rpc |
| 12 | /_vti_inf.html |
| 6 | /usage/errors.php |
| 6 | /data/2004/8052015405242fcc05c9/ |
| 6 | /errors.php |
| 6 | /usage/usage_200407.html/errors.php |
| 6 | /data/2008/3097019549281200ae4f5/ |
| 5 | /helpfiles/index.php |
| 3 | /data/2000/1926530434004ed3c61dc2/ospf.ppt |
| 3 | /xmlrpc.php |
| 2 | /data/2000/113925681240073677d0fb5/ |
| 2 | /indonesia.htm |
| 2 | /workshops/2008/cctld-ams/Sources/Infrastructure/Software-Setup.html |
| 2 | /data/2005/5405798664482744cf3609/ |
| 2 | /search.php |
| 2 | /phpmyadmin1/scripts/setup.php |
| 2 | /data/2006/2027165625448235a528999/ |
| 1 | /workshops/2008/wireless-security/joel/books/monowallhandbook/m0n0wall Handbook_files/trafficgraph.png |
| 1 | /phpmyadmin-2/scripts/setup.php |
| 1 | /workshops/2008/wireless-security/joel/books/monowallhandbook/m0n0wall Handbook_files/sonicwallvpn.png |
| 1 | /workshops/2008/wireless-security/joel/books/monowallhandbook/m0n0wall Handbook_files/wizard-vpn.png |
| 1 | /workshops/2008/wireless-security/joel/books/monowallhandbook/m0n0wall Handbook_files/nat-edit-1to1-www.png |
| 1 | /workshops/2008/wireless-security/joel/books/monowallhandbook/m0n0wall Handbook_files/backuprestore.png |
| 1 | /dbadmin/scripts/setup.php |
| 1 | /organizers/update-temp.php |
| 158 | [not listed: 158 files] |
(Go To: Top | General Summary | Daily Report | Daily Summary | Hourly Summary | Domain Report | Organization Report | Host Report | Status Code Report | File Size Report | File Type Report | Directory Report | Failure Report | Request Report)
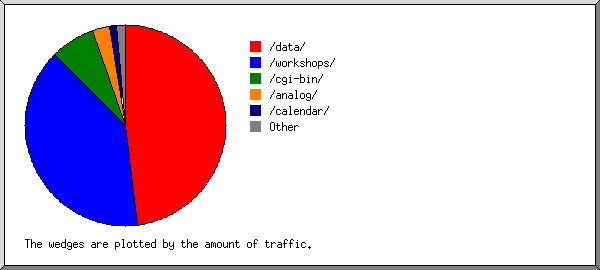
This report lists the files on the site.
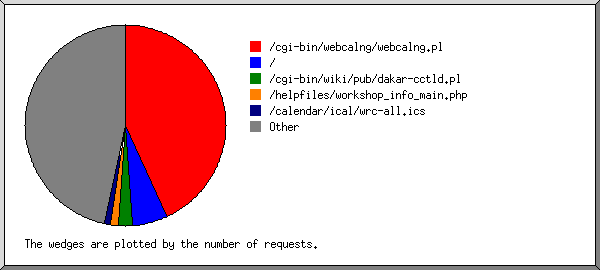
Listing files with at least 20 requests, sorted by the number of requests.
| #reqs | %bytes | last time | file |
|---|
| 2089 | 3.19% | Oct/16/10 4:56 AM | /cgi-bin/webcalng/webcalng.pl |
| 1197 | 0.01% | Oct/16/10 4:57 AM | /usage/usage_201010.html |
| 510 | 0.28% | Oct/16/10 4:53 AM | / |
| 350 | 2.20% | Oct/15/10 10:02 PM | /usage/usage_201009.html |
| 153 | 0.11% | Oct/16/10 4:56 AM | /calendar/ical/wrc-upcoming.ics |
| 149 | 0.08% | Oct/16/10 4:52 AM | /helpfiles/workshop_info_main.php |
| 82 | 0.25% | Oct/15/10 10:06 PM | /data/2004/977264032448268887f66e/Configuracion_Basica_Cisco.pdf |
| 57 | 0.20% | Oct/16/10 3:10 AM | /data/2004/183005930544826a0b6a733/Modulo_01a-OSPF_iBGP_Basico_ipv6.pdf |
| 57 | 0.22% | Oct/15/10 9:06 PM | /data/2004/101532717144826b46d9c9e/Modulo_02a-OSPF_y_eBGP_basico_ipv6.pdf |
| 51 | 0.44% | Oct/16/10 4:34 AM | /calendar/ical/wrc-all.ics |
| 50 | 0.33% | Oct/15/10 8:11 PM | /data/2004/8052015405242fcc05c9/TCP-IP.pdf |
| 40 | 2.09% | Oct/15/10 11:24 PM | /data/2004/873961028427f0b66f130a/junos_sanog.pdf |
| 38 | 0.51% | Oct/16/10 2:09 AM | /data/2008/1904192401492dad184f4db/Cacti.pdf |
| 32 | 0.28% | Oct/16/10 1:53 AM | /data/2006/2027165625448235a528999/cisco_base.ppt |
| 32 | 1.07% | Oct/16/10 3:36 AM | /workshops/2006/PacNOG2/track1/cert/ws-certificate-template.png |
| 31 | 2.98% | Oct/15/10 11:42 PM | /workshops/2004/CEDIA2/material/bgp.pdf |
| 30 | 0.43% | Oct/16/10 1:54 AM | /data/2006/12675549354482287a4f488/telephony.ppt |
| 30 | 0.40% | Oct/16/10 4:04 AM | /data/2004/132703746440d6ea71a7f28/Introduction.ppt |
| 30 | 0.26% | Oct/16/10 12:54 AM | /data/2006/5232033544482348f59f91/bases-ip.pdf |
| 29 | 0.01% | Oct/16/10 4:52 AM | /css/site.css |
| 29 | 0.24% | Oct/16/10 4:04 AM | /workshops/2004/ccTLD-bkk/day1/DNS-Intro.pdf |
| 27 | 0.14% | Oct/16/10 4:36 AM | /data/2004/12233513244826d2f8d0eb/NOC.pdf |
| 26 | 0.35% | Oct/15/10 1:25 PM | /data/2005/5405798664482744cf3609/cisco_base.ppt |
| 25 | 0.29% | Oct/16/10 1:58 AM | /data/2006/71840536244822146cdcf5/introduction-to-cisco-routers.ppt |
| 24 | 0.26% | Oct/16/10 12:35 AM | /data/2004/41394283340524187241c8/Switching-Ethernet.pdf |
| 24 | 1.04% | Oct/16/10 3:39 AM | /data/2004/873961028427f0b66f130a/cli.pdf |
| 23 | 0.11% | Oct/16/10 4:32 AM | /workshops/2006/ccTLD-Samoa/day1/freebsd/freebsdref-1up.pdf |
| 20 | 0.19% | Oct/15/10 1:35 PM | /data/2004/1797176210448267ca02e17/IPv6.pdf |
| 20 | 0.12% | Oct/16/10 3:26 AM | /data/2006/1088814332448214967524c/radius.pdf |
| 20 | 0.04% | Oct/16/10 4:25 AM | /calendar/index.php |
| 4696 | 81.90% | Oct/16/10 4:57 AM | [not listed: 2,700 files] |
 Web Server Statistics for ISOC Workshop Resource Centre
 ) represents 100 requests for pages or part thereof.