Web Server Statistics for ISOC Workshop Resource CentreProgram started on Wed, Jul 06 2011 at 4:50 AM.
Analyzed requests from Wed, Jul 06 2011 at 4:04 AM to Wed, Jul 06 2011 at 4:48 AM (0.03 days).
(Go To: Top | General Summary | Daily Report | Daily Summary | Hourly Summary | Domain Report | Organization Report | Host Report | Status Code Report | File Size Report | File Type Report | Directory Report | Failure Report | Request Report)
This report contains overall statistics.
Successful requests: 270
Average successful requests per day: 8,803
Successful requests for pages: 47
Average successful requests for pages per day: 1,505
Failed requests: 35
Redirected requests: 2
Distinct files requested: 206
Distinct hosts served: 58
Data transferred: 33.21 megabytes
Average data transferred per day: 1.06 gigabytes
(Go To: Top | General Summary | Daily Report | Daily Summary | Hourly Summary | Domain Report | Organization Report | Host Report | Status Code Report | File Size Report | File Type Report | Directory Report | Failure Report | Request Report)
This report lists the activity in each day.
Each unit (
) represents 2 requests for pages or part thereof.
| date | #reqs | #pages | |
|---|---|---|---|
| Jul/ 6/11 | 270 | 47 | ![]() ![]() |
Busiest day: Jul/ 6/11 (47 requests for pages).
(Go To: Top | General Summary | Daily Report | Daily Summary | Hourly Summary | Domain Report | Organization Report | Host Report | Status Code Report | File Size Report | File Type Report | Directory Report | Failure Report | Request Report)
This report lists the total activity for each day of the week, summed over all the weeks in the report.
Each unit (
) represents 2 requests for pages or part thereof.
| day | #reqs | #pages | |
|---|---|---|---|
| Sun | 0 | 0 | |
| Mon | 0 | 0 | |
| Tue | 0 | 0 | |
| Wed | 270 | 47 | ![]() ![]() |
| Thu | 0 | 0 | |
| Fri | 0 | 0 | |
| Sat | 0 | 0 |
(Go To: Top | General Summary | Daily Report | Daily Summary | Hourly Summary | Domain Report | Organization Report | Host Report | Status Code Report | File Size Report | File Type Report | Directory Report | Failure Report | Request Report)
This report lists the total activity for each hour of the day, summed over all the days in the report.
Each unit (
) represents 2 requests for pages or part thereof.
| hour | #reqs | #pages | |
|---|---|---|---|
| 0 | 0 | 0 | |
| 1 | 0 | 0 | |
| 2 | 0 | 0 | |
| 3 | 0 | 0 | |
| 4 | 270 | 47 | ![]() ![]() |
| 5 | 0 | 0 | |
| 6 | 0 | 0 | |
| 7 | 0 | 0 | |
| 8 | 0 | 0 | |
| 9 | 0 | 0 | |
| 10 | 0 | 0 | |
| 11 | 0 | 0 | |
| 12 | 0 | 0 | |
| 13 | 0 | 0 | |
| 14 | 0 | 0 | |
| 15 | 0 | 0 | |
| 16 | 0 | 0 | |
| 17 | 0 | 0 | |
| 18 | 0 | 0 | |
| 19 | 0 | 0 | |
| 20 | 0 | 0 | |
| 21 | 0 | 0 | |
| 22 | 0 | 0 | |
| 23 | 0 | 0 |
(Go To: Top | General Summary | Daily Report | Daily Summary | Hourly Summary | Domain Report | Organization Report | Host Report | Status Code Report | File Size Report | File Type Report | Directory Report | Failure Report | Request Report)
This report lists the countries of the computers which requested files.

Listing domains, sorted by the amount of traffic.
| #reqs | %bytes | domain |
|---|---|---|
| 114 | 31.69% | .com (Commercial) |
| 2 | 21.19% | .uk (United Kingdom) |
| 43 | 14.51% | [unresolved numerical addresses] |
| 64 | 14.33% | .net (Networks) |
| 1 | 9.61% | .tr (Turkey) |
| 4 | 3.15% | .br (Brazil) |
| 7 | 1.89% | .ru (Russia) |
| 10 | 1.01% | .ma (Morocco) |
| 1 | 0.70% | .id (Indonesia) |
| 1 | 0.69% | .se (Sweden) |
| 3 | 0.55% | .in (India) |
| 9 | 0.27% | .edu (US Higher Education) |
| 3 | 0.20% | .ca (Canada) |
| 3 | 0.08% | .ua (Ukraine) |
| 1 | 0.07% | .org (Non Profit Making Organizations) |
| 1 | 0.06% | .us (United States) |
| 3 | .fr (France) |
(Go To: Top | General Summary | Daily Report | Daily Summary | Hourly Summary | Domain Report | Organization Report | Host Report | Status Code Report | File Size Report | File Type Report | Directory Report | Failure Report | Request Report)
This report lists the organizations of the computers which requested files.

Listing the top 20 organizations by the number of requests, sorted by the number of requests.
| #reqs | %bytes | organization |
|---|---|---|
| 97 | 17.59% | googlebot.com |
| 27 | 5.27% | yahoo.net |
| 18 | 0.16% | 64.134 |
| 17 | 1.65% | rima-tde.net |
| 10 | 1.01% | ma |
| 9 | 0.27% | uoregon.edu |
| 8 | 1.96% | ifl.net |
| 8 | 2.43% | 193.95 |
| 7 | 0.86% | 41 |
| 7 | 1.40% | msn.com |
| 6 | 1.89% | yandex.ru |
| 4 | 3.15% | telesp.net.br |
| 3 | 0.53% | pldt.net |
| 3 | dedibox.fr | |
| 3 | 0.55% | 122.airtelbroadband.in |
| 3 | 0.08% | umc.ua |
| 3 | 8.23% | cigna.com |
| 3 | 0.20% | r1.hopcount.ca |
| 2 | 0.95% | 72 |
| 2 | 0.69% | llnw.com |
| 30 | 51.14% | [not listed: 25 organizations] |
(Go To: Top | General Summary | Daily Report | Daily Summary | Hourly Summary | Domain Report | Organization Report | Host Report | Status Code Report | File Size Report | File Type Report | Directory Report | Failure Report | Request Report)
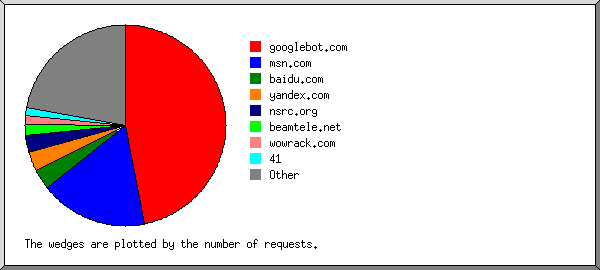
This report lists the computers which requested files.

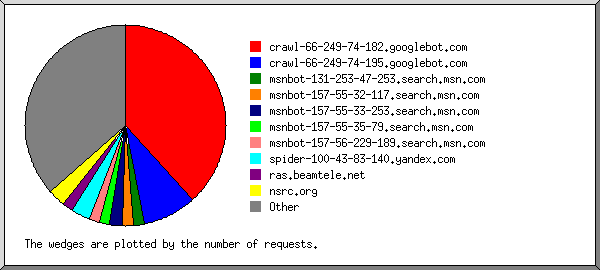
Listing the top 50 hosts by the number of requests, sorted alphabetically.
| #reqs | %bytes | host |
|---|---|---|
| 1 | 0.06% | 27.97.152.187 |
| 1 | 0.08% | 31.184.236.12 |
| 4 | 0.41% | 41.141.128.35 |
| 2 | 0.12% | 41.189.41.228 |
| 18 | 0.16% | 64.134.182.188 |
| 2 | 0.95% | 72.163.188.171 |
| 1 | 4.29% | 80.250.146.56 |
| 1 | 0.78% | 115.241.91.67 |
| 1 | 0.46% | 117.229.68.156 |
| 1 | 4.29% | 163.244.62.164 |
| 8 | 2.43% | 193.95.63.14 |
| 4 | 3.15% | 200-206-195-106.dsl.telesp.net.br |
| 3 | 0.20% | dh21.r1.hopcount.ca |
| 1 | 0.03% | baiduspider-123-125-71-110.crawl.baidu.com |
| 1 | 0.03% | baiduspider-220-181-108-187.crawl.baidu.com |
| 3 | 8.23% | wsuser185.user.cigna.com |
| 95 | 17.52% | crawl-66-249-68-118.googlebot.com |
| 2 | 0.07% | crawl-66-249-68-229.googlebot.com |
| 2 | 0.69% | downside.llnw.com |
| 1 | msnbot-207-46-13-138.search.msn.com | |
| 2 | 0.14% | msnbot-207-46-199-38.search.msn.com |
| 2 | 0.05% | msnbot-207-46-204-35.search.msn.com |
| 1 | 3.66% | virtuefusion.com |
| 1 | 0.01% | 208-115-111-71-reverse.wowrack.com |
| 9 | 0.27% | wirelessu-test.uoregon.edu |
| 3 | sd-30197.dedibox.fr | |
| 1 | 0.70% | ip-189-174.moratelindo.co.id |
| 3 | 0.55% | abts-north-dynamic-049.18.162.122.airtelbroadband.in |
| 10 | 1.01% | ll62-2-70-241-251-62.ll62-2.iam.net.ma |
| 2 | 0.43% | v111-nbh.man.as13285.net |
| 1 | 0.11% | 173-11-97-115-sfba.hfc.comcastbusiness.net |
| 1 | 0.35% | natcrawlbloc01-30.net.m1.fti.net |
| 1 | 0.02% | natcrawlbloc01-31.net.m1.fti.net |
| 2 | 2.97% | bgepxyout-02.asiapac.hp.net |
| 8 | 1.96% | v2035.eth0.proxy01.pf4.sxgfl.ifl.net |
| 3 | 0.53% | 112.200.85.72.pldt.net |
| 9 | 1.52% | 62.red-83-33-59.dynamicip.rima-tde.net |
| 8 | 0.12% | 177.red-80-34-67.staticip.rima-tde.net |
| 1 | 0.87% | 120.168.20.93.rev.sfr.net |
| 27 | 5.27% | b3091098.crawl.yahoo.net |
| 1 | 0.17% | 212-248-166-191.static.yourcomms.net |
| 1 | 0.07% | swan.lax.dns.icann.org |
| 1 | 0.01% | ns2.eurocopter.ru |
| 4 | imparser07.yandex.ru | |
| 2 | 1.89% | spider05.yandex.ru |
| 1 | 0.69% | junior.frobbit.se |
| 1 | proxy3.umc.ua | |
| 1 | 0.07% | proxy4.umc.ua |
| 2 | 21.19% | mail.newcastleinternational.co.uk |
| 1 | 0.06% | chelsea-ce.itd.state.ma.us |
| 8 | 11.36% | [not listed: 8 hosts] |
(Go To: Top | General Summary | Daily Report | Daily Summary | Hourly Summary | Domain Report | Organization Report | Host Report | Status Code Report | File Size Report | File Type Report | Directory Report | Failure Report | Request Report)
This report lists the HTTP status codes of all requests.

Listing status codes, sorted numerically.
| #reqs | status code |
|---|---|
| 233 | 200 OK |
| 26 | 206 Partial content |
| 2 | 301 Document moved permanently |
| 11 | 304 Not modified since last retrieval |
| 35 | 404 Document not found |
(Go To: Top | General Summary | Daily Report | Daily Summary | Hourly Summary | Domain Report | Organization Report | Host Report | Status Code Report | File Size Report | File Type Report | Directory Report | Failure Report | Request Report)
This report lists the sizes of files.

| size | #reqs | %bytes |
|---|---|---|
| 0 | 16 | |
| 1B- 10B | 1 | |
| 11B- 100B | 1 | |
| 101B- 1kB | 25 | 0.02% |
| 1kB- 10kB | 50 | 0.70% |
| 10kB-100kB | 137 | 10.53% |
| 100kB- 1MB | 30 | 24.87% |
| 1MB- 10MB | 10 | 63.87% |
(Go To: Top | General Summary | Daily Report | Daily Summary | Hourly Summary | Domain Report | Organization Report | Host Report | Status Code Report | File Size Report | File Type Report | Directory Report | Failure Report | Request Report)
This report lists the extensions of files.

Listing extensions with at least 0.1% of the traffic, sorted by the amount of traffic.
| #reqs | %bytes | extension |
|---|---|---|
| 55 | 52.46% | .pdf [Adobe Portable Document Format] |
| 15 | 22.42% | .ppt |
| 2 | 12.61% | .jpeg [JPEG graphics] |
| 82 | 4.59% | .pl [Perl scripts] |
| 2 | 1.95% | .png [PNG graphics] |
| 7 | 1.65% | .ics |
| 16 | 1.13% | .html [Hypertext Markup Language] |
| 29 | 0.86% | [directories] |
| 2 | 0.55% | .odp |
| 1 | 0.46% | .doc [Microsoft Word document] |
| 1 | 0.28% | .sxi |
| 9 | 0.24% | .php [PHP] |
| 1 | 0.19% | |
| 4 | 0.16% | .txt [Plain text] |
| 6 | 0.15% | .jpg [JPEG graphics] |
| 2 | 0.12% | .htm [Hypertext Markup Language] |
| 36 | 0.17% | [not listed: 5 extensions] |
(Go To: Top | General Summary | Daily Report | Daily Summary | Hourly Summary | Domain Report | Organization Report | Host Report | Status Code Report | File Size Report | File Type Report | Directory Report | Failure Report | Request Report)
This report lists the directories from which files were requested. (The figures for each directory include all of its subdirectories.)

Listing directories with at least 0.01% of the traffic, sorted by the amount of traffic.
| #reqs | %bytes | directory |
|---|---|---|
| 56 | 61.65% | /data/ |
| 53 | 29.96% | /workshops/ |
| 83 | 4.62% | /cgi-bin/ |
| 9 | 1.77% | /calendar/ |
| 11 | 1.22% | /analog/ |
| 17 | 0.42% | [root directory] |
| 7 | 0.19% | /helpfiles/ |
| 21 | 0.13% | /images/ |
| 3 | 0.04% | /css/ |
| 10 | 0.01% | [not listed: 1 directory] |
(Go To: Top | General Summary | Daily Report | Daily Summary | Hourly Summary | Domain Report | Organization Report | Host Report | Status Code Report | File Size Report | File Type Report | Directory Report | Failure Report | Request Report)
This report lists the files that caused failures, for example files not found.

Listing files, sorted by the number of failed requests.
| #reqs | file |
|---|---|
| 28 | /favicon.ico |
| 2 | /robots.txt |
| 1 | /cgi-bin/wiki/pub/pacnog3.pl |
| 1 | /data/2005/75283141045ae1b2ee5c80/hot.html |
| 1 | /data/2005/75283141045ae1b2ee5c80/asian.html |
| 1 | /data/2005/75283141045ae1b2ee5c80/lesbian.html |
| 1 | /data/2005/75283141045ae1b2ee5c80/girl.html |
(Go To: Top | General Summary | Daily Report | Daily Summary | Hourly Summary | Domain Report | Organization Report | Host Report | Status Code Report | File Size Report | File Type Report | Directory Report | Failure Report | Request Report)
This report lists the files on the site.

Listing files with at least 20 requests, sorted by the number of requests.
| #reqs | %bytes | last time | file |
|---|---|---|---|
| 80 | 4.56% | Jul/ 6/11 4:48 AM | /cgi-bin/webcalng/webcalng.pl |
| 190 | 95.44% | Jul/ 6/11 4:48 AM | [not listed: 122 files] |