Web Server Statistics for ISOC Workshop Resource CentreProgram started on Sun, Feb 19 2006 at 4:24 AM.
Analyzed requests from Sun, Feb 19 2006 at 4:08 AM to Sun, Feb 19 2006 at 4:22 AM (0.01 days).
(Go To: Top | General Summary | Monthly Report | Weekly Report | Daily Report | Daily Summary | Hourly Summary | Domain Report | Organization Report | Host Report | Status Code Report | File Size Report | File Type Report | Directory Report | Request Report)
This report contains overall statistics.
Successful requests: 30
Successful requests for pages: 14
Redirected requests: 3
Distinct files requested: 26
Distinct hosts served: 23
Corrupt logfile lines: 7
Data transferred: 987.66 kilobytes
(Go To: Top | General Summary | Monthly Report | Weekly Report | Daily Report | Daily Summary | Hourly Summary | Domain Report | Organization Report | Host Report | Status Code Report | File Size Report | File Type Report | Directory Report | Request Report)
This report lists the activity in each month.
Each unit (
) represents 1 request for a page.
| month | #reqs | #pages | |
|---|---|---|---|
| Feb 2006 | 30 | 14 | ![]() ![]() ![]() |
Busiest month: Feb 2006 (14 requests for pages).
(Go To: Top | General Summary | Monthly Report | Weekly Report | Daily Report | Daily Summary | Hourly Summary | Domain Report | Organization Report | Host Report | Status Code Report | File Size Report | File Type Report | Directory Report | Request Report)
This report lists the activity in each week.
Each unit (
) represents 1 request for a page.
| week beg. | #reqs | #pages | |
|---|---|---|---|
| Feb/19/06 | 30 | 14 | ![]() ![]() ![]() |
Busiest week: week beginning Feb/19/06 (14 requests for pages).
(Go To: Top | General Summary | Monthly Report | Weekly Report | Daily Report | Daily Summary | Hourly Summary | Domain Report | Organization Report | Host Report | Status Code Report | File Size Report | File Type Report | Directory Report | Request Report)
This report lists the activity in each day.
Each unit (
) represents 1 request for a page.
| date | #reqs | #pages | |
|---|---|---|---|
| Feb/19/06 | 30 | 14 | ![]() ![]() ![]() |
Busiest day: Feb/19/06 (14 requests for pages).
(Go To: Top | General Summary | Monthly Report | Weekly Report | Daily Report | Daily Summary | Hourly Summary | Domain Report | Organization Report | Host Report | Status Code Report | File Size Report | File Type Report | Directory Report | Request Report)
This report lists the total activity for each day of the week, summed over all the weeks in the report.
Each unit (
) represents 1 request for a page.
| day | #reqs | #pages | |
|---|---|---|---|
| Sun | 30 | 14 | ![]() ![]() ![]() |
| Mon | 0 | 0 | |
| Tue | 0 | 0 | |
| Wed | 0 | 0 | |
| Thu | 0 | 0 | |
| Fri | 0 | 0 | |
| Sat | 0 | 0 |
(Go To: Top | General Summary | Monthly Report | Weekly Report | Daily Report | Daily Summary | Hourly Summary | Domain Report | Organization Report | Host Report | Status Code Report | File Size Report | File Type Report | Directory Report | Request Report)
This report lists the total activity for each hour of the day, summed over all the days in the report.
Each unit (
) represents 1 request for a page.
| hour | #reqs | #pages | |
|---|---|---|---|
| 0 | 0 | 0 | |
| 1 | 0 | 0 | |
| 2 | 0 | 0 | |
| 3 | 0 | 0 | |
| 4 | 30 | 14 | ![]() ![]() ![]() |
| 5 | 0 | 0 | |
| 6 | 0 | 0 | |
| 7 | 0 | 0 | |
| 8 | 0 | 0 | |
| 9 | 0 | 0 | |
| 10 | 0 | 0 | |
| 11 | 0 | 0 | |
| 12 | 0 | 0 | |
| 13 | 0 | 0 | |
| 14 | 0 | 0 | |
| 15 | 0 | 0 | |
| 16 | 0 | 0 | |
| 17 | 0 | 0 | |
| 18 | 0 | 0 | |
| 19 | 0 | 0 | |
| 20 | 0 | 0 | |
| 21 | 0 | 0 | |
| 22 | 0 | 0 | |
| 23 | 0 | 0 |
(Go To: Top | General Summary | Monthly Report | Weekly Report | Daily Report | Daily Summary | Hourly Summary | Domain Report | Organization Report | Host Report | Status Code Report | File Size Report | File Type Report | Directory Report | Request Report)
This report lists the countries of the computers which requested files.

Listing domains, sorted by the amount of traffic.
| #reqs | %bytes | domain |
|---|---|---|
| 2 | 65.66% | [unresolved numerical addresses] |
| 23 | 28.45% | .com (Commercial) |
| 1 | 5.06% | .fr (France) |
| 1 | 0.83% | .th (Thailand) |
| 3 | .edu (US Higher Education) |
(Go To: Top | General Summary | Monthly Report | Weekly Report | Daily Report | Daily Summary | Hourly Summary | Domain Report | Organization Report | Host Report | Status Code Report | File Size Report | File Type Report | Directory Report | Request Report)
This report lists the organizations of the computers which requested files.

Listing organizations, sorted by the number of requests.
| #reqs | %bytes | organization |
|---|---|---|
| 18 | 27.12% | googlebot.com |
| 3 | uoregon.edu | |
| 3 | 0.33% | inktomisearch.com |
| 1 | 32.10% | 213.140 |
| 1 | 1.00% | looksmart.com |
| 1 | ask.com | |
| 1 | 33.56% | 203.92 |
| 1 | 5.06% | wanadoo.fr |
| 1 | 0.83% | asianet.co.th |
(Go To: Top | General Summary | Monthly Report | Weekly Report | Daily Report | Daily Summary | Hourly Summary | Domain Report | Organization Report | Host Report | Status Code Report | File Size Report | File Type Report | Directory Report | Request Report)
This report lists the computers which requested files.

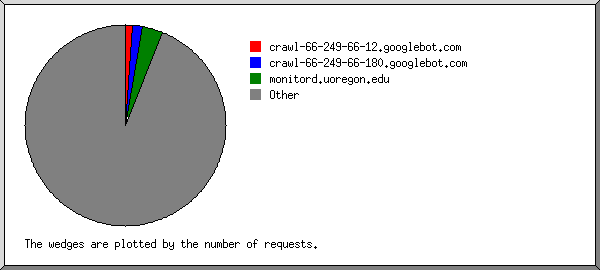
Listing hosts, sorted alphabetically.
| #reqs | %bytes | host |
|---|---|---|
| 1 | 33.56% | 203.92.45.198 |
| 1 | 32.10% | 213.140.56.3 |
| 1 | egspd42469.ask.com | |
| 2 | 0.67% | crawl-66-249-64-16.googlebot.com |
| 1 | 0.67% | crawl-66-249-64-27.googlebot.com |
| 1 | crawl-66-249-64-28.googlebot.com | |
| 1 | crawl-66-249-64-4.googlebot.com | |
| 2 | 2.78% | crawl-66-249-64-42.googlebot.com |
| 1 | 1.90% | crawl-66-249-64-52.googlebot.com |
| 3 | 13.48% | crawl-66-249-64-58.googlebot.com |
| 1 | crawl-66-249-71-39.googlebot.com | |
| 1 | 0.99% | crawl-66-249-71-41.googlebot.com |
| 1 | crawl-66-249-71-54.googlebot.com | |
| 1 | 0.57% | crawl-66-249-71-57.googlebot.com |
| 2 | 5.64% | crawl-66-249-71-73.googlebot.com |
| 1 | 0.43% | crawl-66-249-71-78.googlebot.com |
| 1 | 0.24% | lj2051.inktomisearch.com |
| 1 | lj2408.inktomisearch.com | |
| 1 | 0.10% | lj2550.inktomisearch.com |
| 1 | 1.00% | sv-crawlfw3.looksmart.com |
| 3 | monitord.uoregon.edu | |
| 1 | 5.06% | amarseille-251-1-37-113.w81-251.abo.wanadoo.fr |
| 1 | 0.83% | gb.jb.98.142.revip.asianet.co.th |
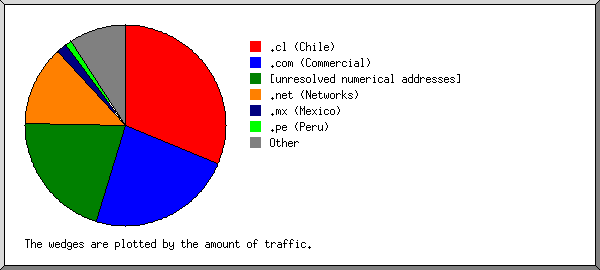
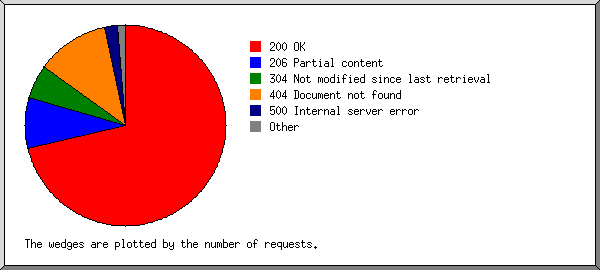
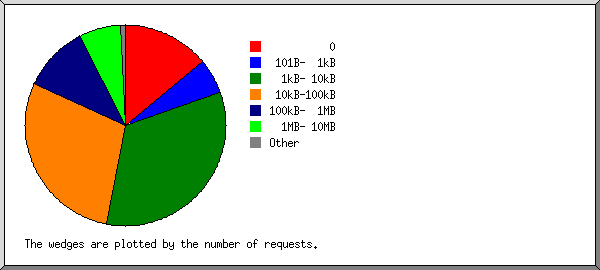
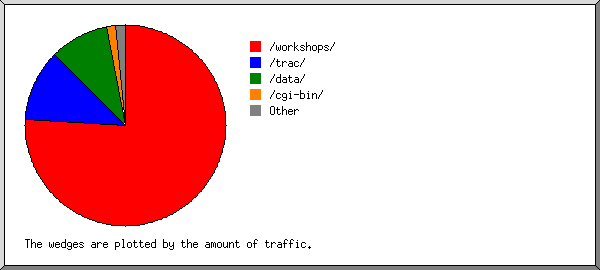
(Go To: Top | General Summary | Monthly Report | Weekly Report | Daily Report | Daily Summary | Hourly Summary | Domain Report | Organization Report | Host Report | Status Code Report | File Size Report | File Type Report | Directory Report | Request Report)
This report lists the HTTP status codes of all requests.

Listing status codes, sorted numerically.
| #reqs | status code |
|---|---|
| 22 | 200 OK |
| 1 | 301 Document moved permanently |
| 2 | 302 Document found elsewhere |
| 8 | 304 Not modified since last retrieval |
(Go To: Top | General Summary | Monthly Report | Weekly Report | Daily Report | Daily Summary | Hourly Summary | Domain Report | Organization Report | Host Report | Status Code Report | File Size Report | File Type Report | Directory Report | Request Report)
This report lists the sizes of files.

| size | #reqs | %bytes |
|---|---|---|
| 0 | 11 | |
| 1B- 10B | 0 | |
| 11B- 100B | 0 | |
| 101B- 1kB | 1 | 0.10% |
| 1kB- 10kB | 11 | 7.31% |
| 10kB-100kB | 4 | 13.74% |
| 100kB- 1MB | 3 | 78.86% |
(Go To: Top | General Summary | Monthly Report | Weekly Report | Daily Report | Daily Summary | Hourly Summary | Domain Report | Organization Report | Host Report | Status Code Report | File Size Report | File Type Report | Directory Report | Request Report)
This report lists the extensions of files.

Listing extensions with at least 0.1% of the traffic, sorted by the amount of traffic.
| #reqs | %bytes | extension |
|---|---|---|
| 3 | 65.66% | .ppt |
| 3 | 18.26% | .sxi |
| 8 | 7.84% | [directories] |
| 7 | 6.42% | .php [PHP] |
| 6 | 1.82% | .html [Hypertext Markup Language] |
| 3 | [not listed: 2 extensions] |
(Go To: Top | General Summary | Monthly Report | Weekly Report | Daily Report | Daily Summary | Hourly Summary | Domain Report | Organization Report | Host Report | Status Code Report | File Size Report | File Type Report | Directory Report | Request Report)
This report lists the directories from which files were requested. (The figures for each directory include all of its subdirectories.)

Listing directories with at least 0.01% of the traffic, sorted by the amount of traffic.
| #reqs | %bytes | directory |
|---|---|---|
| 5 | 78.86% | /data/ |
| 7 | 5.39% | /workshops/ |
| 1 | 4.87% | /calendar/ |
| 5 | 3.80% | [root directory] |
| 3 | 1.62% | /helpfiles/ |
| 4 | 1.59% | /archive/ |
| 1 | 1.00% | /organizers/ |
| 1 | 0.99% | /materials/ |
| 1 | 0.88% | /instructors/ |
| 1 | 0.57% | /planning/ |
| 1 | 0.43% | /scripts/ |
(Go To: Top | General Summary | Monthly Report | Weekly Report | Daily Report | Daily Summary | Hourly Summary | Domain Report | Organization Report | Host Report | Status Code Report | File Size Report | File Type Report | Directory Report | Request Report)
This report lists the files on the site.
Listing files with at least 20 requests, sorted by the number of requests.
| #reqs | %bytes | last time | file |
|---|---|---|---|
| 30 | 100% | Feb/19/06 4:22 AM | [not listed: 25 files] |